29
/fr/
fr
AIzaSyAYiBZKx7MnpbEhh9jyipgxe19OcubqV5w
April 1, 2024
240683
Singapore
SGP
true
2
1
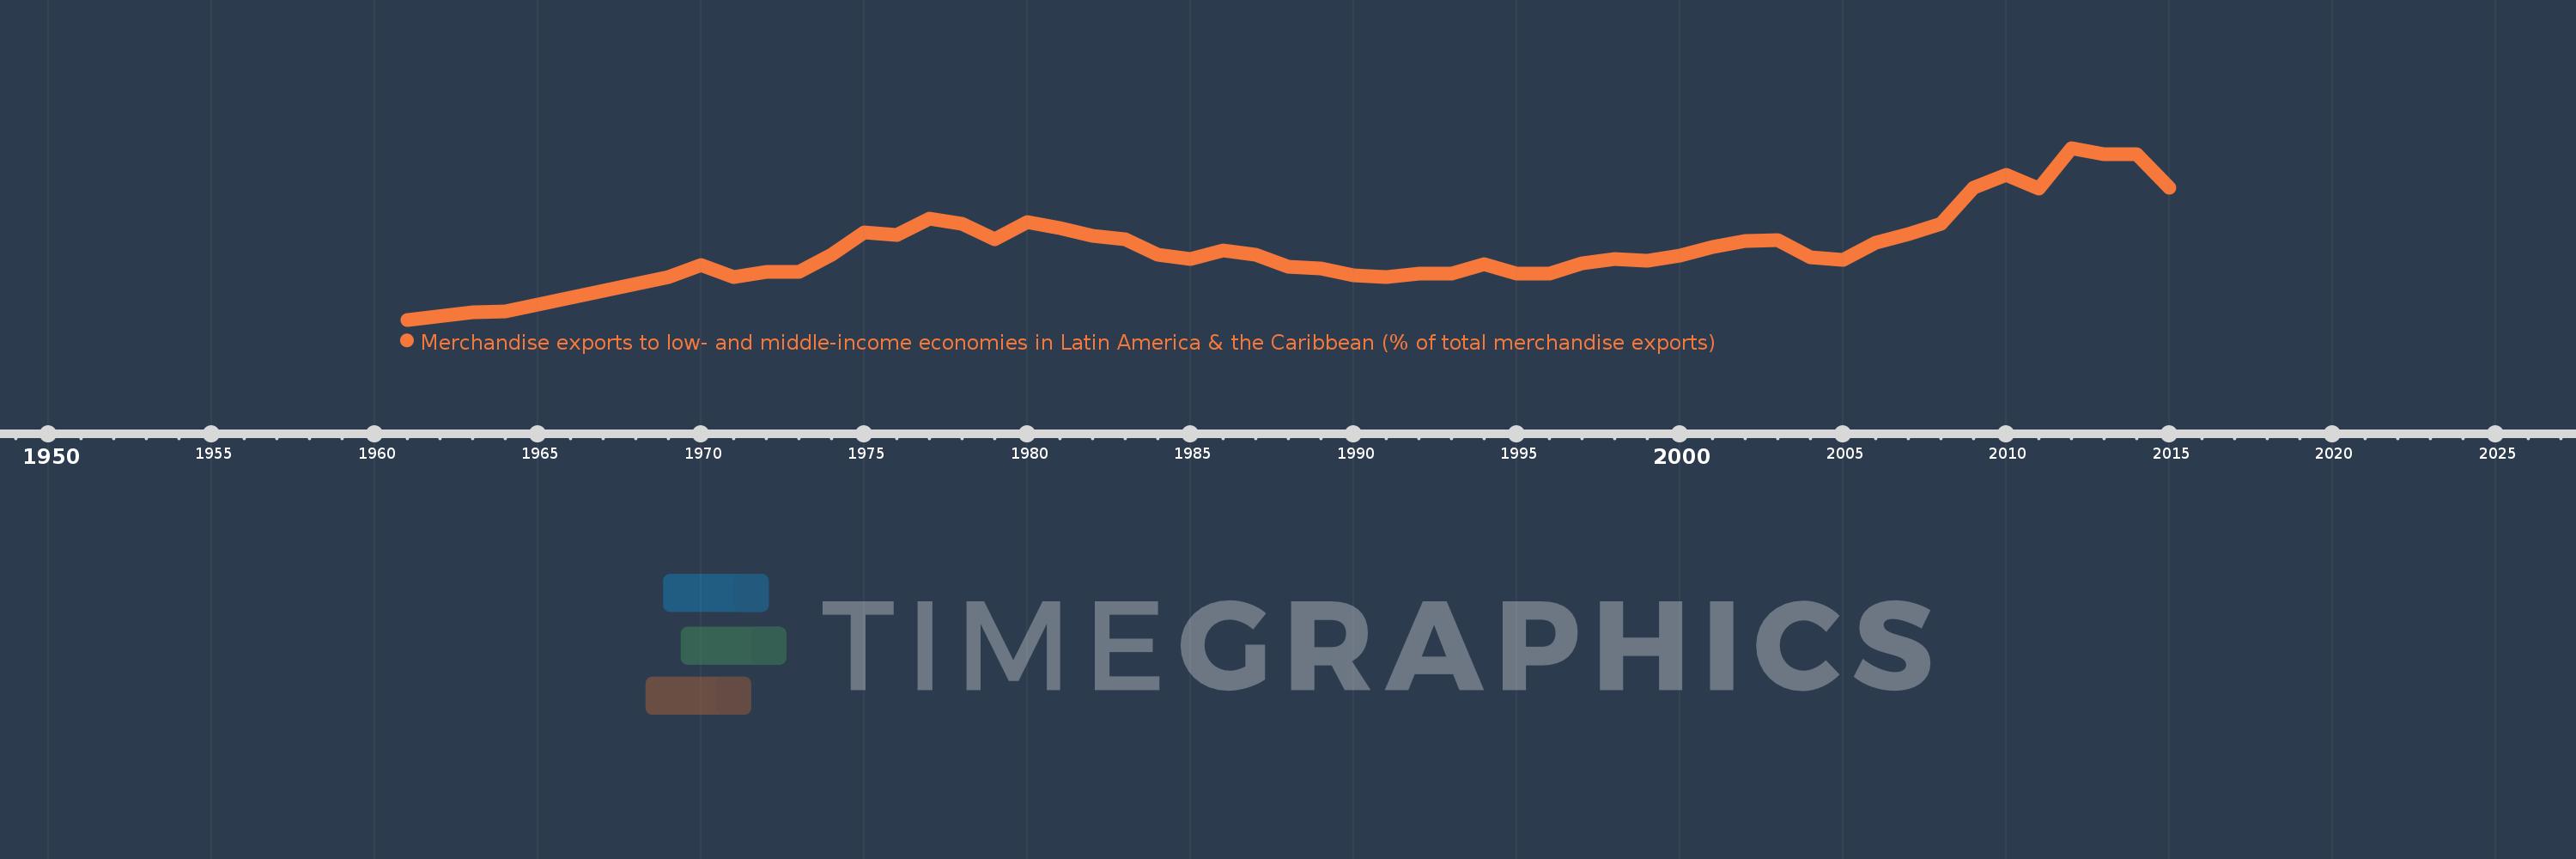
Merchandise exports to low- and middle-income economies in Latin America & the Caribbean (% of total merchandise exports)
2015,2014,2013,2012,2011,2010,2009,2008,2007,2006,2005,2004,2003,2002,2001,2000,1999,1998,1997,1996,1995,1994,1993,1992,1991,1990,1989,1988,1987,1986,1985,1984,1983,1982,1981,1980,1979,1978,1977,1976,1975,1974,1973,1972,1971,1970,1969,1964,1963,1961
Cette statistique dans les autres pays:
AfghanistanAlbaniaAlgeriaAngolaAntigua and BarbudaArab WorldArgentinaArmeniaArubaAustraliaAustriaAzerbaijanBahamas, TheBahrainBangladeshBarbadosBelarusBelgiumBelizeBeninBermudaBoliviaBrazilBrunei DarussalamBulgariaBurundiCabo VerdeCambodiaCameroonCanadaCaribbean small statesCentral African RepublicCentral Europe and the BalticsChileChinaColombiaCongo, Dem. Rep.Congo, Rep.Costa RicaCote d'IvoireCroatiaCubaCyprusCzech RepublicDenmarkDominicaDominican RepublicEarly-demographic dividendEast Asia & PacificEast Asia & Pacific (excluding high income)East Asia & Pacific (IDA & IBRD countries)EcuadorEgypt, Arab Rep.El SalvadorEstoniaEthiopiaEuro areaEurope & Central AsiaEurope & Central Asia (excluding high income)Europe & Central Asia (IDA & IBRD countries)European UnionFaroe IslandsFijiFinlandFragile and conflict affected situationsFranceFrench PolynesiaGabonGambia, TheGeorgiaGermanyGhanaGibraltarGreeceGreenlandGrenadaGuatemalaGuineaGuyanaHaitiHeavily indebted poor countries (HIPC)High incomeHondurasHong Kong SAR, ChinaHungaryIBRD onlyIcelandIDA & IBRD totalIDA blendIDA onlyIDA totalIndiaIndonesiaIran, Islamic Rep.IraqIrelandIsraelItalyJamaicaJapanJordanKazakhstanKenyaKorea, Dem. People’s Rep.Korea, Rep.KuwaitLao PDRLate-demographic dividendLatin America & Caribbean Latin America & Caribbean (excluding high income)Latin America & the Caribbean (IDA & IBRD countries)LatviaLeast developed countries: UN classificationLebanonLiberiaLibyaLithuaniaLow & middle incomeLow incomeLower middle incomeLuxembourgMacao SAR, ChinaMacedonia, FYRMadagascarMalawiMalaysiaMaliMaltaMauritaniaMauritiusMexicoMiddle East & North AfricaMiddle East & North Africa (excluding high income)Middle East & North Africa (IDA & IBRD countries)Middle incomeMongoliaMontenegroMoroccoMozambiqueMyanmarNetherlandsNew CaledoniaNew ZealandNicaraguaNigerNigeriaNorth AmericaNorwayOECD membersOmanOther small statesPacific island small statesPakistanPanamaPapua New GuineaParaguayPeruPhilippinesPolandPortugalPost-demographic dividendPre-demographic dividendQatarRomaniaRussian FederationRwandaSamoaSaudi ArabiaSenegalSerbiaSierra LeoneSingaporeSlovak RepublicSloveniaSmall statesSomaliaSouth AfricaSouth AsiaSouth Asia (IDA & IBRD)SpainSri LankaSt. Kitts and NevisSt. LuciaSt. Vincent and the GrenadinesSub-Saharan Africa Sub-Saharan Africa (excluding high income)Sub-Saharan Africa (IDA & IBRD countries)SudanSurinameSwedenSwitzerlandSyrian Arab RepublicTanzaniaThailandTogoTrinidad and TobagoTunisiaTurkeyUgandaUkraineUnited Arab EmiratesUnited KingdomUnited StatesUpper middle incomeUruguayVenezuela, RBVietnamWorldYemen, Rep.ZambiaZimbabwe La ligne de temps
Cette échelle de temps montre un graphique de 1961 année à 2015 année Singapore. Les données jusqu'à 1960 année ne sont pas présentés. Quantité d'observations actuelles selon dates: 50.
Source (désignation):
Les indicateurs du développement mondiale
Source (organisation):
World Bank staff estimates based data from International Monetary Fund's Direction of Trade database.
Catégories:
Private Sector, Trade
Dernière mise à jour
23 avr. 2017
Les indicateurs de changement de valeurs selon les années
Maximum:
3.881
1 janv. 2012
Pour la date d''observation
Valeur
Changement absolu
Le changement par rapport à la valeur précédente
1 janv. 1963
0.167
+0.167
%
1 janv. 1964
0.182
+0.015
8.94%
1 janv. 1969
0.964
+0.782
430.36%
1 janv. 1970
1.231
+0.268
27.78%
1 janv. 1971
0.963
-0.268
-21.77%
1 janv. 1972
1.083
+0.119
12.38%
1 janv. 1973
1.072
-0.01
-0.95%
1 janv. 1974
1.475
+0.403
37.57%
1 janv. 1975
1.974
+0.498
33.79%
1 janv. 1976
1.923
-0.051
-2.58%
1 janv. 1977
2.277
+0.355
18.44%
1 janv. 1978
2.166
-0.111
-4.87%
1 janv. 1979
1.827
-0.34
-15.69%
1 janv. 1980
2.207
+0.38
20.81%
1 janv. 1981
2.068
-0.139
-6.28%
1 janv. 1982
1.905
-0.163
-7.89%
1 janv. 1983
1.817
-0.088
-4.63%
1 janv. 1984
1.47
-0.347
-19.07%
1 janv. 1985
1.375
-0.096
-6.51%
1 janv. 1986
1.565
+0.19
13.82%
1 janv. 1987
1.465
-0.099
-6.35%
1 janv. 1988
1.205
-0.26
-17.78%
1 janv. 1989
1.151
-0.054
-4.48%
1 janv. 1990
0.996
-0.155
-13.44%
1 janv. 1991
0.97
-0.026
-2.64%
1 janv. 1992
1.046
+0.076
7.81%
1 janv. 1993
1.042
-0.004
-0.36%
1 janv. 1994
1.251
+0.209
20.09%
1 janv. 1995
1.045
-0.206
-16.44%
1 janv. 1996
1.037
-0.008
-0.77%
1 janv. 1997
1.268
+0.231
22.26%
1 janv. 1998
1.372
+0.104
8.17%
1 janv. 1999
1.327
-0.045
-3.25%
1 janv. 2000
1.454
+0.127
9.57%
1 janv. 2001
1.651
+0.197
13.54%
1 janv. 2002
1.778
+0.127
7.7%
1 janv. 2003
1.796
+0.018
0.99%
1 janv. 2004
1.406
-0.389
-21.68%
1 janv. 2005
1.347
-0.059
-4.23%
1 janv. 2006
1.742
+0.395
29.3%
1 janv. 2007
1.93
+0.188
10.8%
1 janv. 2008
2.165
+0.235
12.17%
1 janv. 2009
2.988
+0.823
38.01%
1 janv. 2010
3.276
+0.288
9.64%
1 janv. 2011
2.971
-0.305
-9.31%
1 janv. 2012
3.881
+0.91
30.64%
1 janv. 2013
3.742
-0.139
-3.57%
1 janv. 2014
3.738
-0.005
-0.12%
1 janv. 2015
2.979
-0.758
-20.29%
Classement des pays selon les statistiques actuelles par années


Commentaires: