29
/fr/
fr
AIzaSyAYiBZKx7MnpbEhh9jyipgxe19OcubqV5w
April 1, 2024
54980
Post-demographic dividend
PST
false
2
1
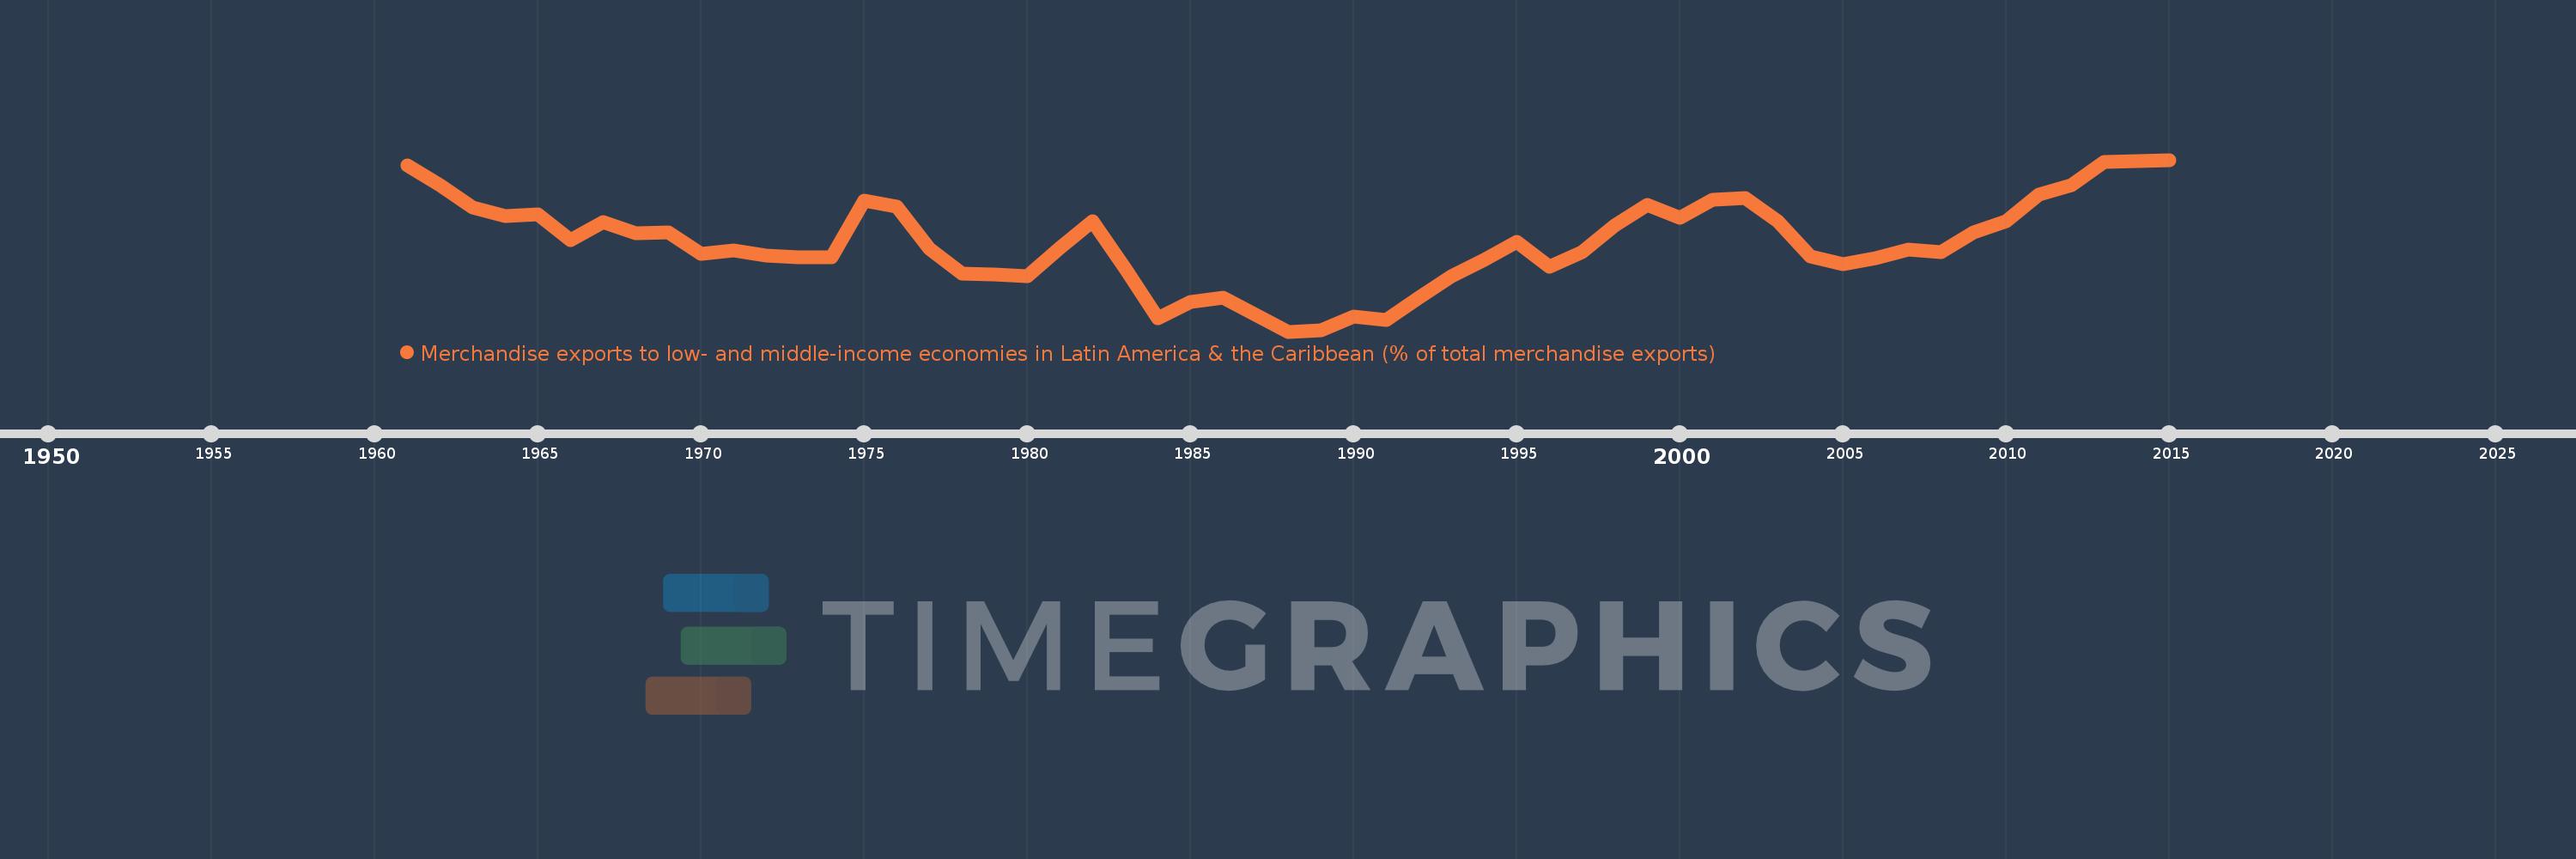
Merchandise exports to low- and middle-income economies in Latin America & the Caribbean (% of total merchandise exports)
2015,2014,2013,2012,2011,2010,2009,2008,2007,2006,2005,2004,2003,2002,2001,2000,1999,1998,1997,1996,1995,1994,1993,1992,1991,1990,1989,1988,1987,1986,1985,1984,1983,1982,1981,1980,1979,1978,1977,1976,1975,1974,1973,1972,1971,1970,1969,1968,1967,1966,1965,1964,1963,1962,1961
Cette statistique dans les autres pays:
AfghanistanAlbaniaAlgeriaAngolaAntigua and BarbudaArab WorldArgentinaArmeniaArubaAustraliaAustriaAzerbaijanBahamas, TheBahrainBangladeshBarbadosBelarusBelgiumBelizeBeninBermudaBoliviaBrazilBrunei DarussalamBulgariaBurundiCabo VerdeCambodiaCameroonCanadaCaribbean small statesCentral African RepublicCentral Europe and the BalticsChileChinaColombiaCongo, Dem. Rep.Congo, Rep.Costa RicaCote d'IvoireCroatiaCubaCyprusCzech RepublicDenmarkDominicaDominican RepublicEarly-demographic dividendEast Asia & PacificEast Asia & Pacific (excluding high income)East Asia & Pacific (IDA & IBRD countries)EcuadorEgypt, Arab Rep.El SalvadorEstoniaEthiopiaEuro areaEurope & Central AsiaEurope & Central Asia (excluding high income)Europe & Central Asia (IDA & IBRD countries)European UnionFaroe IslandsFijiFinlandFragile and conflict affected situationsFranceFrench PolynesiaGabonGambia, TheGeorgiaGermanyGhanaGibraltarGreeceGreenlandGrenadaGuatemalaGuineaGuyanaHaitiHeavily indebted poor countries (HIPC)High incomeHondurasHong Kong SAR, ChinaHungaryIBRD onlyIcelandIDA & IBRD totalIDA blendIDA onlyIDA totalIndiaIndonesiaIran, Islamic Rep.IraqIrelandIsraelItalyJamaicaJapanJordanKazakhstanKenyaKorea, Dem. People’s Rep.Korea, Rep.KuwaitLao PDRLate-demographic dividendLatin America & Caribbean Latin America & Caribbean (excluding high income)Latin America & the Caribbean (IDA & IBRD countries)LatviaLeast developed countries: UN classificationLebanonLiberiaLibyaLithuaniaLow & middle incomeLow incomeLower middle incomeLuxembourgMacao SAR, ChinaMacedonia, FYRMadagascarMalawiMalaysiaMaliMaltaMauritaniaMauritiusMexicoMiddle East & North AfricaMiddle East & North Africa (excluding high income)Middle East & North Africa (IDA & IBRD countries)Middle incomeMongoliaMontenegroMoroccoMozambiqueMyanmarNetherlandsNew CaledoniaNew ZealandNicaraguaNigerNigeriaNorth AmericaNorwayOECD membersOmanOther small statesPacific island small statesPakistanPanamaPapua New GuineaParaguayPeruPhilippinesPolandPortugalPost-demographic dividendPre-demographic dividendQatarRomaniaRussian FederationRwandaSamoaSaudi ArabiaSenegalSerbiaSierra LeoneSingaporeSlovak RepublicSloveniaSmall statesSomaliaSouth AfricaSouth AsiaSouth Asia (IDA & IBRD)SpainSri LankaSt. Kitts and NevisSt. LuciaSt. Vincent and the GrenadinesSub-Saharan Africa Sub-Saharan Africa (excluding high income)Sub-Saharan Africa (IDA & IBRD countries)SudanSurinameSwedenSwitzerlandSyrian Arab RepublicTanzaniaThailandTogoTrinidad and TobagoTunisiaTurkeyUgandaUkraineUnited Arab EmiratesUnited KingdomUnited StatesUpper middle incomeUruguayVenezuela, RBVietnamWorldYemen, Rep.ZambiaZimbabwe La ligne de temps
Cette échelle de temps montre un graphique de 1961 année à 2015 année Post-demographic dividend. Les données jusqu'à 1960 année ne sont pas présentés. Quantité d'observations actuelles selon dates: 55.
Source (désignation):
Les indicateurs du développement mondiale
Source (organisation):
World Bank staff estimates based data from International Monetary Fund's Direction of Trade database.
Catégories:
Private Sector, Trade
Dernière mise à jour
23 avr. 2017
Les indicateurs de changement de valeurs selon les années
Minimum:
2.808
1 janv. 1988
Maximum:
5.475
1 janv. 2015
Pour la date d''observation
Valeur
Changement absolu
Le changement par rapport à la valeur précédente
1 janv. 1961
5.39
+5.39
0.0%
1 janv. 1962
5.079
-0.311
-5.77%
1 janv. 1963
4.734
-0.345
-6.8%
1 janv. 1964
4.602
-0.132
-2.78%
1 janv. 1965
4.634
+0.032
0.68%
1 janv. 1966
4.228
-0.406
-8.76%
1 janv. 1967
4.513
+0.285
6.75%
1 janv. 1968
4.335
-0.178
-3.95%
1 janv. 1969
4.35
+0.015
0.35%
1 janv. 1970
4.009
-0.341
-7.84%
1 janv. 1971
4.072
+0.062
1.55%
1 janv. 1972
3.991
-0.08
-1.98%
1 janv. 1973
3.966
-0.025
-0.63%
1 janv. 1974
3.964
-0.002
-0.04%
1 janv. 1975
4.837
+0.873
22.01%
1 janv. 1976
4.751
-0.086
-1.79%
1 janv. 1977
4.094
-0.657
-13.82%
1 janv. 1978
3.703
-0.391
-9.55%
1 janv. 1979
3.692
-0.011
-0.3%
1 janv. 1980
3.662
-0.03
-0.8%
1 janv. 1981
4.105
+0.442
12.08%
1 janv. 1982
4.516
+0.411
10.01%
1 janv. 1983
3.793
-0.723
-16.0%
1 janv. 1984
3.018
-0.776
-20.45%
1 janv. 1985
3.263
+0.245
8.12%
1 janv. 1986
3.341
+0.078
2.4%
1 janv. 1987
3.063
-0.278
-8.31%
1 janv. 1988
2.808
-0.255
-8.34%
1 janv. 1989
2.831
+0.023
0.81%
1 janv. 1990
3.044
+0.213
7.51%
1 janv. 1991
2.985
-0.059
-1.94%
1 janv. 1992
3.329
+0.344
11.54%
1 janv. 1993
3.669
+0.34
10.21%
1 janv. 1994
3.921
+0.253
6.89%
1 janv. 1995
4.201
+0.28
7.13%
1 janv. 1996
3.821
-0.38
-9.05%
1 janv. 1997
4.04
+0.219
5.74%
1 janv. 1998
4.455
+0.415
10.27%
1 janv. 1999
4.773
+0.318
7.14%
1 janv. 2000
4.569
-0.204
-4.27%
1 janv. 2001
4.86
+0.29
6.36%
1 janv. 2002
4.886
+0.026
0.54%
1 janv. 2003
4.525
-0.361
-7.39%
1 janv. 2004
3.97
-0.555
-12.27%
1 janv. 2005
3.85
-0.12
-3.01%
1 janv. 2006
3.942
+0.092
2.38%
1 janv. 2007
4.083
+0.141
3.57%
1 janv. 2008
4.041
-0.042
-1.02%
1 janv. 2009
4.354
+0.313
7.74%
1 janv. 2010
4.526
+0.171
3.94%
1 janv. 2011
4.934
+0.408
9.03%
1 janv. 2012
5.081
+0.147
2.98%
1 janv. 2013
5.442
+0.361
7.11%
1 janv. 2014
5.453
+0.011
0.2%
1 janv. 2015
5.475
+0.022
0.4%
Classement des pays selon les statistiques actuelles par années


Commentaires: