29
/fr/
fr
AIzaSyAYiBZKx7MnpbEhh9jyipgxe19OcubqV5w
April 1, 2024
63106
World
WLD
false
2
1
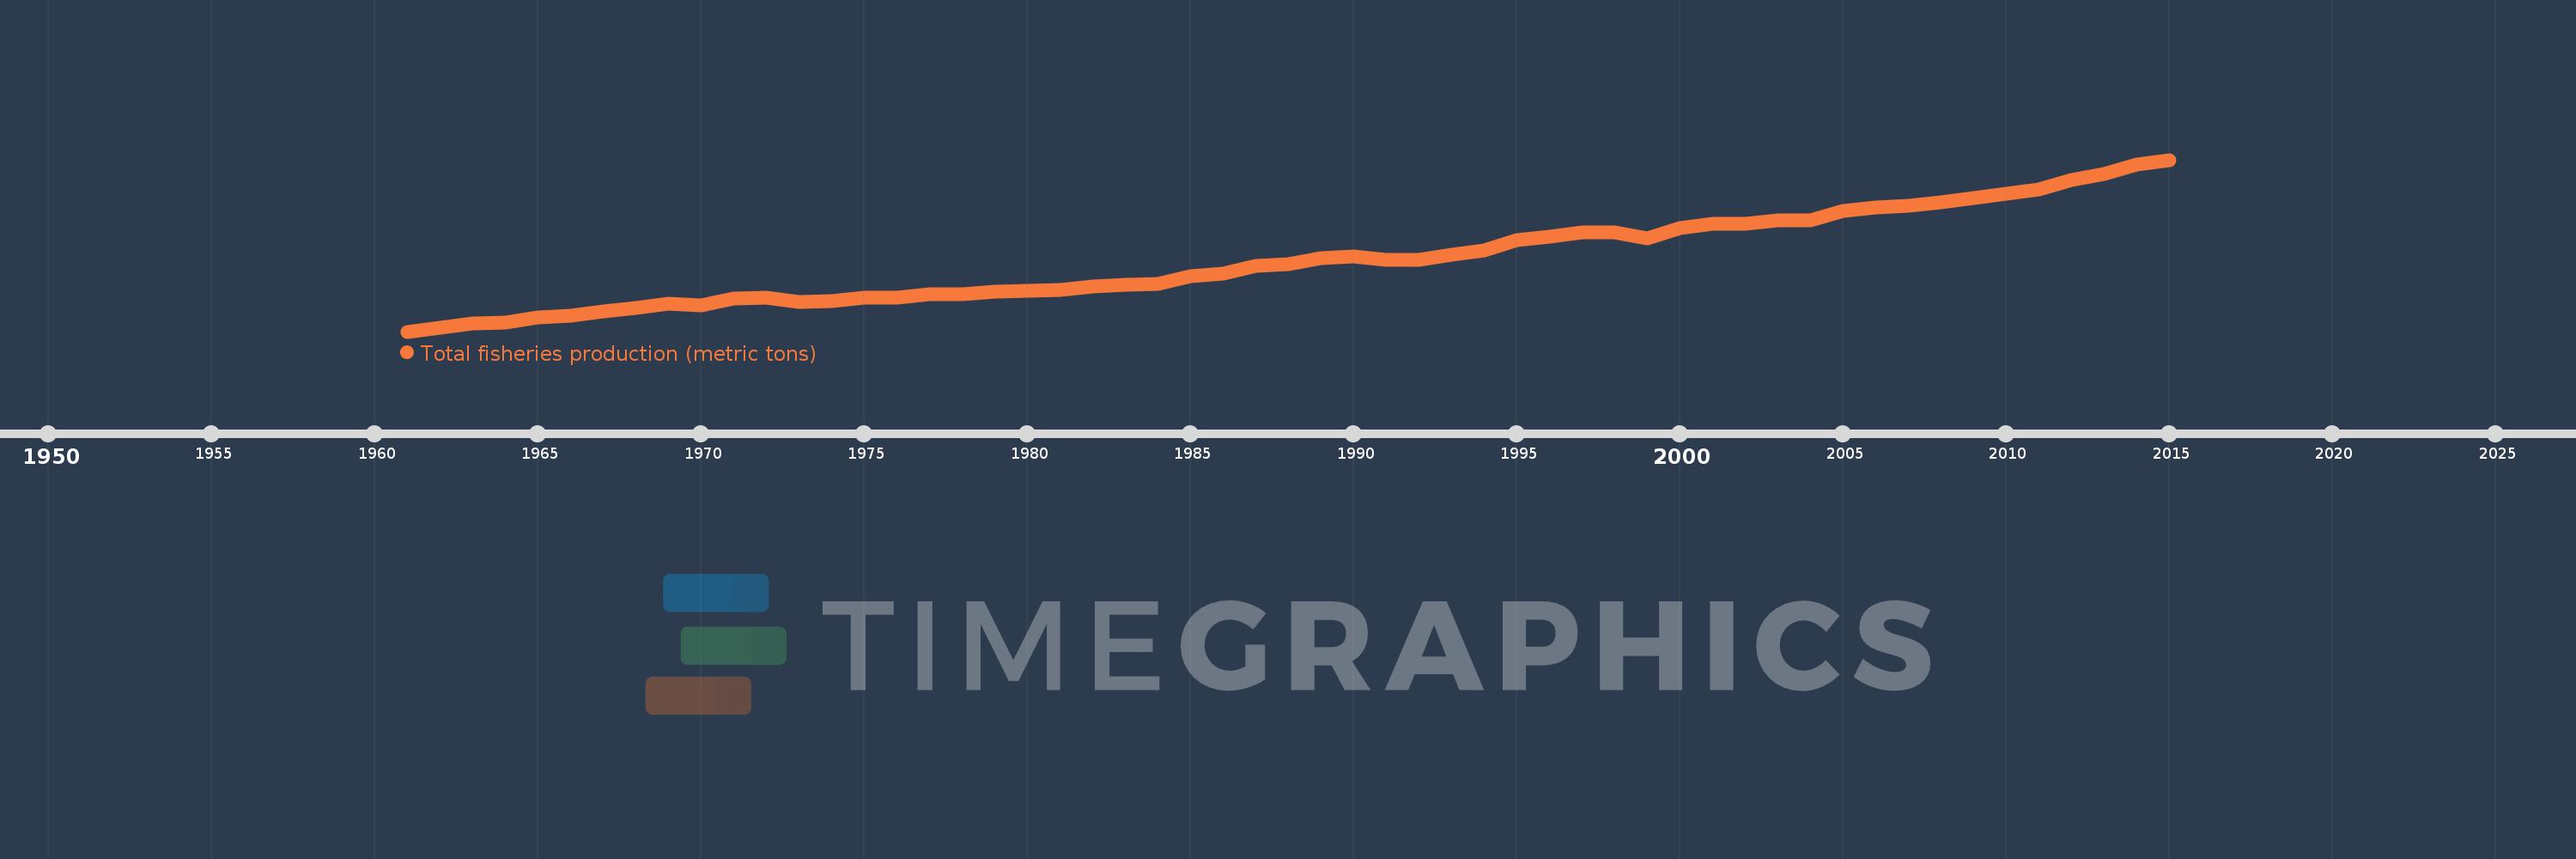
Total fisheries production (metric tons)
2015,2014,2013,2012,2011,2010,2009,2008,2007,2006,2005,2004,2003,2002,2001,2000,1999,1998,1997,1996,1995,1994,1993,1992,1991,1990,1989,1988,1987,1986,1985,1984,1983,1982,1981,1980,1979,1978,1977,1976,1975,1974,1973,1972,1971,1970,1969,1968,1967,1966,1965,1964,1963,1962,1961
Cette statistique dans les autres pays:
AfghanistanAlbaniaAlgeriaAmerican SamoaAngolaAntigua and BarbudaArab WorldArgentinaArmeniaArubaAustraliaAustriaAzerbaijanBahamas, TheBahrainBangladeshBarbadosBelarusBelgiumBelizeBeninBermudaBhutanBoliviaBosnia and HerzegovinaBotswanaBrazilBritish Virgin IslandsBrunei DarussalamBulgariaBurkina FasoBurundiCabo VerdeCambodiaCameroonCanadaCaribbean small statesCayman IslandsCentral African RepublicCentral Europe and the BalticsChadChannel IslandsChileChinaColombiaComorosCongo, Dem. Rep.Congo, Rep.Costa RicaCote d'IvoireCroatiaCubaCuracaoCyprusCzech RepublicDenmarkDjiboutiDominicaDominican RepublicEarly-demographic dividendEast Asia & PacificEast Asia & Pacific (excluding high income)East Asia & Pacific (IDA & IBRD countries)EcuadorEgypt, Arab Rep.El SalvadorEquatorial GuineaEritreaEstoniaEthiopiaEuro areaEurope & Central AsiaEurope & Central Asia (excluding high income)Europe & Central Asia (IDA & IBRD countries)European UnionFaroe IslandsFijiFinlandFragile and conflict affected situationsFranceFrench PolynesiaGabonGambia, TheGeorgiaGermanyGhanaGreeceGreenlandGrenadaGuamGuatemalaGuineaGuinea-BissauGuyanaHaitiHeavily indebted poor countries (HIPC)High incomeHondurasHong Kong SAR, ChinaHungaryIBRD onlyIcelandIDA & IBRD totalIDA blendIDA onlyIDA totalIndiaIndonesiaIran, Islamic Rep.IraqIrelandIsle of ManIsraelItalyJamaicaJapanJordanKazakhstanKenyaKiribatiKorea, Dem. People’s Rep.Korea, Rep.KuwaitKyrgyz RepublicLao PDRLate-demographic dividendLatin America & Caribbean Latin America & Caribbean (excluding high income)Latin America & the Caribbean (IDA & IBRD countries)LatviaLeast developed countries: UN classificationLebanonLesothoLiberiaLibyaLithuaniaLow & middle incomeLow incomeLower middle incomeMacao SAR, ChinaMacedonia, FYRMadagascarMalawiMalaysiaMaldivesMaliMaltaMarshall IslandsMauritaniaMauritiusMexicoMicronesia, Fed. Sts.Middle East & North AfricaMiddle East & North Africa (excluding high income)Middle East & North Africa (IDA & IBRD countries)Middle incomeMoldovaMonacoMongoliaMontenegroMoroccoMozambiqueMyanmarNamibiaNauruNepalNetherlandsNew CaledoniaNew ZealandNicaraguaNigerNigeriaNorth AmericaNorthern Mariana IslandsNorwayOECD membersOmanOther small statesPacific island small statesPakistanPalauPanamaPapua New GuineaParaguayPeruPhilippinesPolandPortugalPost-demographic dividendPre-demographic dividendPuerto RicoQatarRomaniaRussian FederationRwandaSamoaSao Tome and PrincipeSaudi ArabiaSenegalSerbiaSeychellesSierra LeoneSingaporeSint Maarten (Dutch part)Slovak RepublicSloveniaSmall statesSolomon IslandsSomaliaSouth AfricaSouth AsiaSouth Asia (IDA & IBRD)South SudanSpainSri LankaSt. Kitts and NevisSt. LuciaSt. Martin (French part)St. Vincent and the GrenadinesSub-Saharan Africa Sub-Saharan Africa (excluding high income)Sub-Saharan Africa (IDA & IBRD countries)SudanSurinameSwazilandSwedenSwitzerlandSyrian Arab RepublicTajikistanTanzaniaThailandTimor-LesteTogoTongaTrinidad and TobagoTunisiaTurkeyTurkmenistanTurks and Caicos IslandsTuvaluUgandaUkraineUnited Arab EmiratesUnited KingdomUnited StatesUpper middle incomeUruguayUzbekistanVanuatuVenezuela, RBVietnamVirgin Islands (U.S.)West Bank and GazaWorldYemen, Rep.ZambiaZimbabwe La ligne de temps
Cette échelle de temps montre un graphique de 1961 année à 2015 année World. Les données jusqu'à 1960 année ne sont pas présentés. Quantité d'observations actuelles selon dates: 55.
Source (désignation):
Les indicateurs du développement mondiale
Source (organisation):
Food and Agriculture Organization.
Catégories:
Environment
Dernière mise à jour
23 avr. 2017
Les indicateurs de changement de valeurs selon les années
Minimum:
36.786 mln.
1 janv. 1961
Maximum:
195.784 mln.
1 janv. 2015
Pour la date d''observation
Valeur
Changement absolu
Le changement par rapport à la valeur précédente
1 janv. 1961
36.786 mln.
+36.786 mln.
0.0%
1 janv. 1962
40.548 mln.
+3.762 mln.
10.23%
1 janv. 1963
44.04 mln.
+3.491 mln.
8.61%
1 janv. 1964
45.224 mln.
+1.184 mln.
2.69%
1 janv. 1965
49.995 mln.
+4.771 mln.
10.55%
1 janv. 1966
51.257 mln.
+1.261 mln.
2.52%
1 janv. 1967
55.356 mln.
+4.099 mln.
8.0%
1 janv. 1968
58.923 mln.
+3.567 mln.
6.44%
1 janv. 1969
62.423 mln.
+3.5 mln.
5.94%
1 janv. 1970
61.139 mln.
-1.284 mln.
-2.06%
1 janv. 1971
67.393 mln.
+6.254 mln.
10.23%
1 janv. 1972
67.843 mln.
+449.841 milles
0.67%
1 janv. 1973
63.956 mln.
-3.887 mln.
-5.73%
1 janv. 1974
64.741 mln.
+784.866 milles
1.23%
1 janv. 1975
68.413 mln.
+3.672 mln.
5.67%
1 janv. 1976
68.162 mln.
-250.801 milles
-0.37%
1 janv. 1977
71.739 mln.
+3.577 mln.
5.25%
1 janv. 1978
71.364 mln.
-375.003 milles
-0.52%
1 janv. 1979
73.71 mln.
+2.346 mln.
3.29%
1 janv. 1980
74.299 mln.
+589.314 milles
0.8%
1 janv. 1981
75.607 mln.
+1.308 mln.
1.76%
1 janv. 1982
78.127 mln.
+2.52 mln.
3.33%
1 janv. 1983
80.335 mln.
+2.207 mln.
2.83%
1 janv. 1984
81.04 mln.
+704.994 milles
0.88%
1 janv. 1985
87.85 mln.
+6.81 mln.
8.4%
1 janv. 1986
90.726 mln.
+2.877 mln.
3.27%
1 janv. 1987
97.597 mln.
+6.871 mln.
7.57%
1 janv. 1988
99.554 mln.
+1.956 mln.
2.0%
1 janv. 1989
104.59 mln.
+5.036 mln.
5.06%
1 janv. 1990
106.067 mln.
+1.477 mln.
1.41%
1 janv. 1991
102.852 mln.
-3.215 mln.
-3.03%
1 janv. 1992
103.205 mln.
+352.767 milles
0.34%
1 janv. 1993
107.6 mln.
+4.395 mln.
4.26%
1 janv. 1994
112.193 mln.
+4.593 mln.
4.27%
1 janv. 1995
121.142 mln.
+8.948 mln.
7.98%
1 janv. 1996
124.907 mln.
+3.766 mln.
3.11%
1 janv. 1997
128.921 mln.
+4.014 mln.
3.21%
1 janv. 1998
128.734 mln.
-186.99 milles
-0.15%
1 janv. 1999
123.306 mln.
-5.429 mln.
-4.22%
1 janv. 2000
132.401 mln.
+9.095 mln.
7.38%
1 janv. 2001
136.477 mln.
+4.076 mln.
3.08%
1 janv. 2002
136.286 mln.
-190.917 milles
-0.14%
1 janv. 2003
139.646 mln.
+3.36 mln.
2.47%
1 janv. 2004
139.817 mln.
+170.919 milles
0.12%
1 janv. 2005
148.734 mln.
+8.917 mln.
6.38%
1 janv. 2006
151.505 mln.
+2.771 mln.
1.86%
1 janv. 2007
152.928 mln.
+1.423 mln.
0.94%
1 janv. 2008
156.818 mln.
+3.89 mln.
2.54%
1 janv. 2009
160.205 mln.
+3.388 mln.
2.16%
1 janv. 2010
164.352 mln.
+4.147 mln.
2.59%
1 janv. 2011
168.223 mln.
+3.871 mln.
2.36%
1 janv. 2012
177.444 mln.
+9.221 mln.
5.48%
1 janv. 2013
182.485 mln.
+5.04 mln.
2.84%
1 janv. 2014
191.121 mln.
+8.636 mln.
4.73%
1 janv. 2015
195.784 mln.
+4.663 mln.
2.44%
Classement des pays selon les statistiques actuelles par années


Commentaires: