29
/fr/
fr
AIzaSyAYiBZKx7MnpbEhh9jyipgxe19OcubqV5w
April 1, 2024
41977
Latin America & Caribbean
LCN
false
2
1
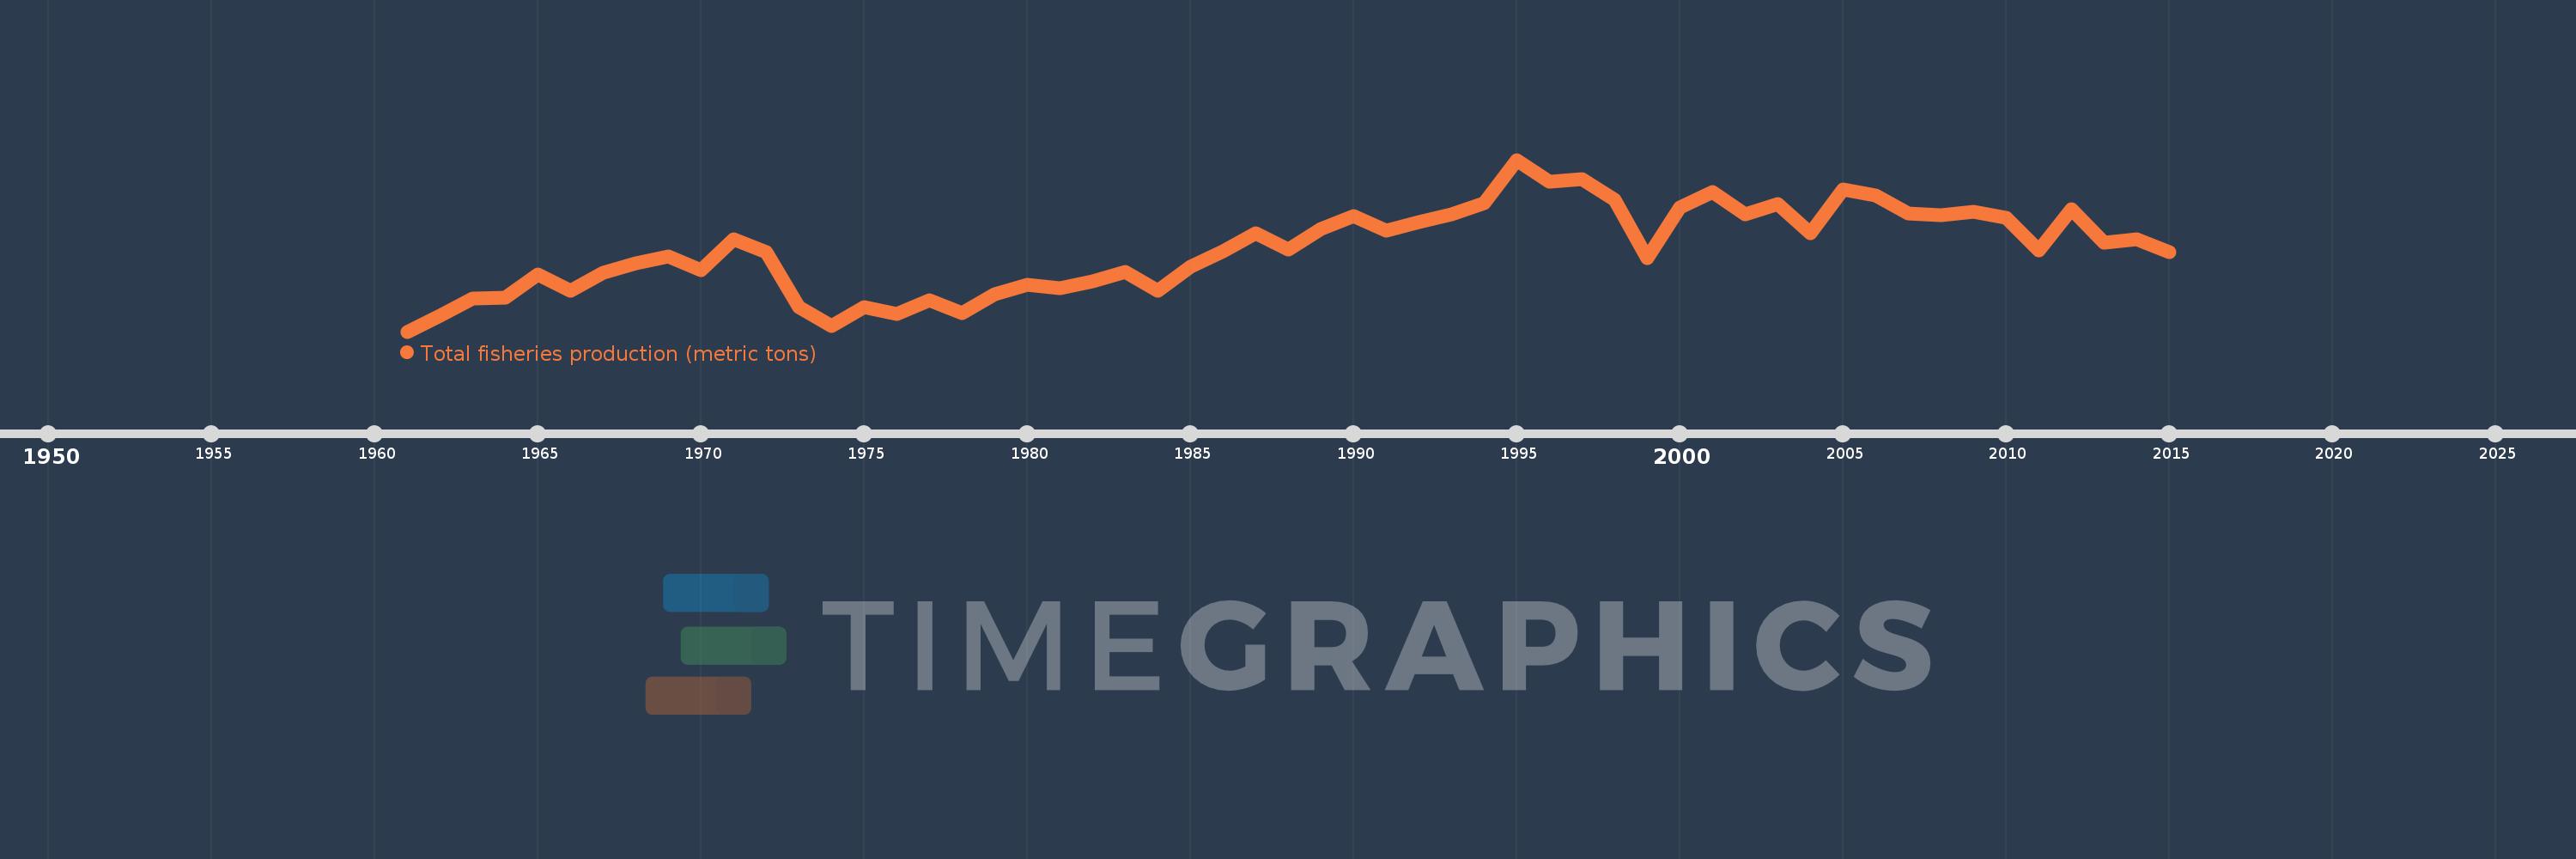
Total fisheries production (metric tons)
2015,2014,2013,2012,2011,2010,2009,2008,2007,2006,2005,2004,2003,2002,2001,2000,1999,1998,1997,1996,1995,1994,1993,1992,1991,1990,1989,1988,1987,1986,1985,1984,1983,1982,1981,1980,1979,1978,1977,1976,1975,1974,1973,1972,1971,1970,1969,1968,1967,1966,1965,1964,1963,1962,1961
Cette statistique dans les autres pays:
AfghanistanAlbaniaAlgeriaAmerican SamoaAngolaAntigua and BarbudaArab WorldArgentinaArmeniaArubaAustraliaAustriaAzerbaijanBahamas, TheBahrainBangladeshBarbadosBelarusBelgiumBelizeBeninBermudaBhutanBoliviaBosnia and HerzegovinaBotswanaBrazilBritish Virgin IslandsBrunei DarussalamBulgariaBurkina FasoBurundiCabo VerdeCambodiaCameroonCanadaCaribbean small statesCayman IslandsCentral African RepublicCentral Europe and the BalticsChadChannel IslandsChileChinaColombiaComorosCongo, Dem. Rep.Congo, Rep.Costa RicaCote d'IvoireCroatiaCubaCuracaoCyprusCzech RepublicDenmarkDjiboutiDominicaDominican RepublicEarly-demographic dividendEast Asia & PacificEast Asia & Pacific (excluding high income)East Asia & Pacific (IDA & IBRD countries)EcuadorEgypt, Arab Rep.El SalvadorEquatorial GuineaEritreaEstoniaEthiopiaEuro areaEurope & Central AsiaEurope & Central Asia (excluding high income)Europe & Central Asia (IDA & IBRD countries)European UnionFaroe IslandsFijiFinlandFragile and conflict affected situationsFranceFrench PolynesiaGabonGambia, TheGeorgiaGermanyGhanaGreeceGreenlandGrenadaGuamGuatemalaGuineaGuinea-BissauGuyanaHaitiHeavily indebted poor countries (HIPC)High incomeHondurasHong Kong SAR, ChinaHungaryIBRD onlyIcelandIDA & IBRD totalIDA blendIDA onlyIDA totalIndiaIndonesiaIran, Islamic Rep.IraqIrelandIsle of ManIsraelItalyJamaicaJapanJordanKazakhstanKenyaKiribatiKorea, Dem. People’s Rep.Korea, Rep.KuwaitKyrgyz RepublicLao PDRLate-demographic dividendLatin America & Caribbean Latin America & Caribbean (excluding high income)Latin America & the Caribbean (IDA & IBRD countries)LatviaLeast developed countries: UN classificationLebanonLesothoLiberiaLibyaLithuaniaLow & middle incomeLow incomeLower middle incomeMacao SAR, ChinaMacedonia, FYRMadagascarMalawiMalaysiaMaldivesMaliMaltaMarshall IslandsMauritaniaMauritiusMexicoMicronesia, Fed. Sts.Middle East & North AfricaMiddle East & North Africa (excluding high income)Middle East & North Africa (IDA & IBRD countries)Middle incomeMoldovaMonacoMongoliaMontenegroMoroccoMozambiqueMyanmarNamibiaNauruNepalNetherlandsNew CaledoniaNew ZealandNicaraguaNigerNigeriaNorth AmericaNorthern Mariana IslandsNorwayOECD membersOmanOther small statesPacific island small statesPakistanPalauPanamaPapua New GuineaParaguayPeruPhilippinesPolandPortugalPost-demographic dividendPre-demographic dividendPuerto RicoQatarRomaniaRussian FederationRwandaSamoaSao Tome and PrincipeSaudi ArabiaSenegalSerbiaSeychellesSierra LeoneSingaporeSint Maarten (Dutch part)Slovak RepublicSloveniaSmall statesSolomon IslandsSomaliaSouth AfricaSouth AsiaSouth Asia (IDA & IBRD)South SudanSpainSri LankaSt. Kitts and NevisSt. LuciaSt. Martin (French part)St. Vincent and the GrenadinesSub-Saharan Africa Sub-Saharan Africa (excluding high income)Sub-Saharan Africa (IDA & IBRD countries)SudanSurinameSwazilandSwedenSwitzerlandSyrian Arab RepublicTajikistanTanzaniaThailandTimor-LesteTogoTongaTrinidad and TobagoTunisiaTurkeyTurkmenistanTurks and Caicos IslandsTuvaluUgandaUkraineUnited Arab EmiratesUnited KingdomUnited StatesUpper middle incomeUruguayUzbekistanVanuatuVenezuela, RBVietnamVirgin Islands (U.S.)West Bank and GazaWorldYemen, Rep.ZambiaZimbabwe La ligne de temps
Cette échelle de temps montre un graphique de 1961 année à 2015 année Latin America & Caribbean . Les données jusqu'à 1960 année ne sont pas présentés. Quantité d'observations actuelles selon dates: 55.
Source (désignation):
Les indicateurs du développement mondiale
Source (organisation):
Food and Agriculture Organization.
Catégories:
Environment
Dernière mise à jour
23 avr. 2017
Les indicateurs de changement de valeurs selon les années
Minimum:
4.671 mln.
1 janv. 1961
Maximum:
24.674 mln.
1 janv. 1995
Pour la date d''observation
Valeur
Changement absolu
Le changement par rapport à la valeur précédente
1 janv. 1961
4.671 mln.
+4.671 mln.
0.0%
1 janv. 1962
6.547 mln.
+1.875 mln.
40.14%
1 janv. 1963
8.547 mln.
+2.001 mln.
30.56%
1 janv. 1964
8.632 mln.
+85.051 milles
1.0%
1 janv. 1965
11.362 mln.
+2.73 mln.
31.62%
1 janv. 1966
9.373 mln.
-1.988 mln.
-17.5%
1 janv. 1967
11.493 mln.
+2.12 mln.
22.61%
1 janv. 1968
12.65 mln.
+1.157 mln.
10.07%
1 janv. 1969
13.445 mln.
+794.48 milles
6.28%
1 janv. 1970
11.791 mln.
-1.653 mln.
-12.3%
1 janv. 1971
15.444 mln.
+3.653 mln.
30.98%
1 janv. 1972
13.898 mln.
-1.546 mln.
-10.01%
1 janv. 1973
7.535 mln.
-6.362 mln.
-45.78%
1 janv. 1974
5.364 mln.
-2.171 mln.
-28.82%
1 janv. 1975
7.532 mln.
+2.169 mln.
40.43%
1 janv. 1976
6.728 mln.
-804.386 milles
-10.68%
1 janv. 1977
8.312 mln.
+1.584 mln.
23.55%
1 janv. 1978
6.857 mln.
-1.456 mln.
-17.51%
1 janv. 1979
9.026 mln.
+2.169 mln.
31.64%
1 janv. 1980
10.165 mln.
+1.139 mln.
12.62%
1 janv. 1981
9.675 mln.
-490.444 milles
-4.82%
1 janv. 1982
10.48 mln.
+804.98 milles
8.32%
1 janv. 1983
11.59 mln.
+1.11 mln.
10.59%
1 janv. 1984
9.446 mln.
-2.144 mln.
-18.5%
1 janv. 1985
12.271 mln.
+2.825 mln.
29.9%
1 janv. 1986
14.03 mln.
+1.759 mln.
14.33%
1 janv. 1987
16.159 mln.
+2.129 mln.
15.18%
1 janv. 1988
14.188 mln.
-1.971 mln.
-12.2%
1 janv. 1989
16.651 mln.
+2.463 mln.
17.36%
1 janv. 1990
18.117 mln.
+1.466 mln.
8.8%
1 janv. 1991
16.407 mln.
-1.71 mln.
-9.44%
1 janv. 1992
17.448 mln.
+1.041 mln.
6.35%
1 janv. 1993
18.297 mln.
+848.982 milles
4.87%
1 janv. 1994
19.643 mln.
+1.346 mln.
7.36%
1 janv. 1995
24.674 mln.
+5.031 mln.
25.61%
1 janv. 1996
22.096 mln.
-2.578 mln.
-10.45%
1 janv. 1997
22.452 mln.
+355.984 milles
1.61%
1 janv. 1998
20.037 mln.
-2.415 mln.
-10.75%
1 janv. 1999
13.264 mln.
-6.773 mln.
-33.8%
1 janv. 2000
19.099 mln.
+5.835 mln.
43.99%
1 janv. 2001
20.88 mln.
+1.781 mln.
9.32%
1 janv. 2002
18.292 mln.
-2.588 mln.
-12.39%
1 janv. 2003
19.487 mln.
+1.195 mln.
6.53%
1 janv. 2004
16.123 mln.
-3.364 mln.
-17.26%
1 janv. 2005
21.198 mln.
+5.075 mln.
31.48%
1 janv. 2006
20.543 mln.
-654.985 milles
-3.09%
1 janv. 2007
18.41 mln.
-2.133 mln.
-10.38%
1 janv. 2008
18.244 mln.
-166.371 milles
-0.9%
1 janv. 2009
18.597 mln.
+353.384 milles
1.94%
1 janv. 2010
17.948 mln.
-649.759 milles
-3.49%
1 janv. 2011
14.148 mln.
-3.799 mln.
-21.17%
1 janv. 2012
18.901 mln.
+4.753 mln.
33.59%
1 janv. 2013
15.051 mln.
-3.85 mln.
-20.37%
1 janv. 2014
15.459 mln.
+407.773 milles
2.71%
1 janv. 2015
13.957 mln.
-1.501 mln.
-9.71%
Classement des pays selon les statistiques actuelles par années


Commentaires: