29
/fr/
fr
AIzaSyAYiBZKx7MnpbEhh9jyipgxe19OcubqV5w
April 1, 2024
223015
Peru
PER
true
2
1
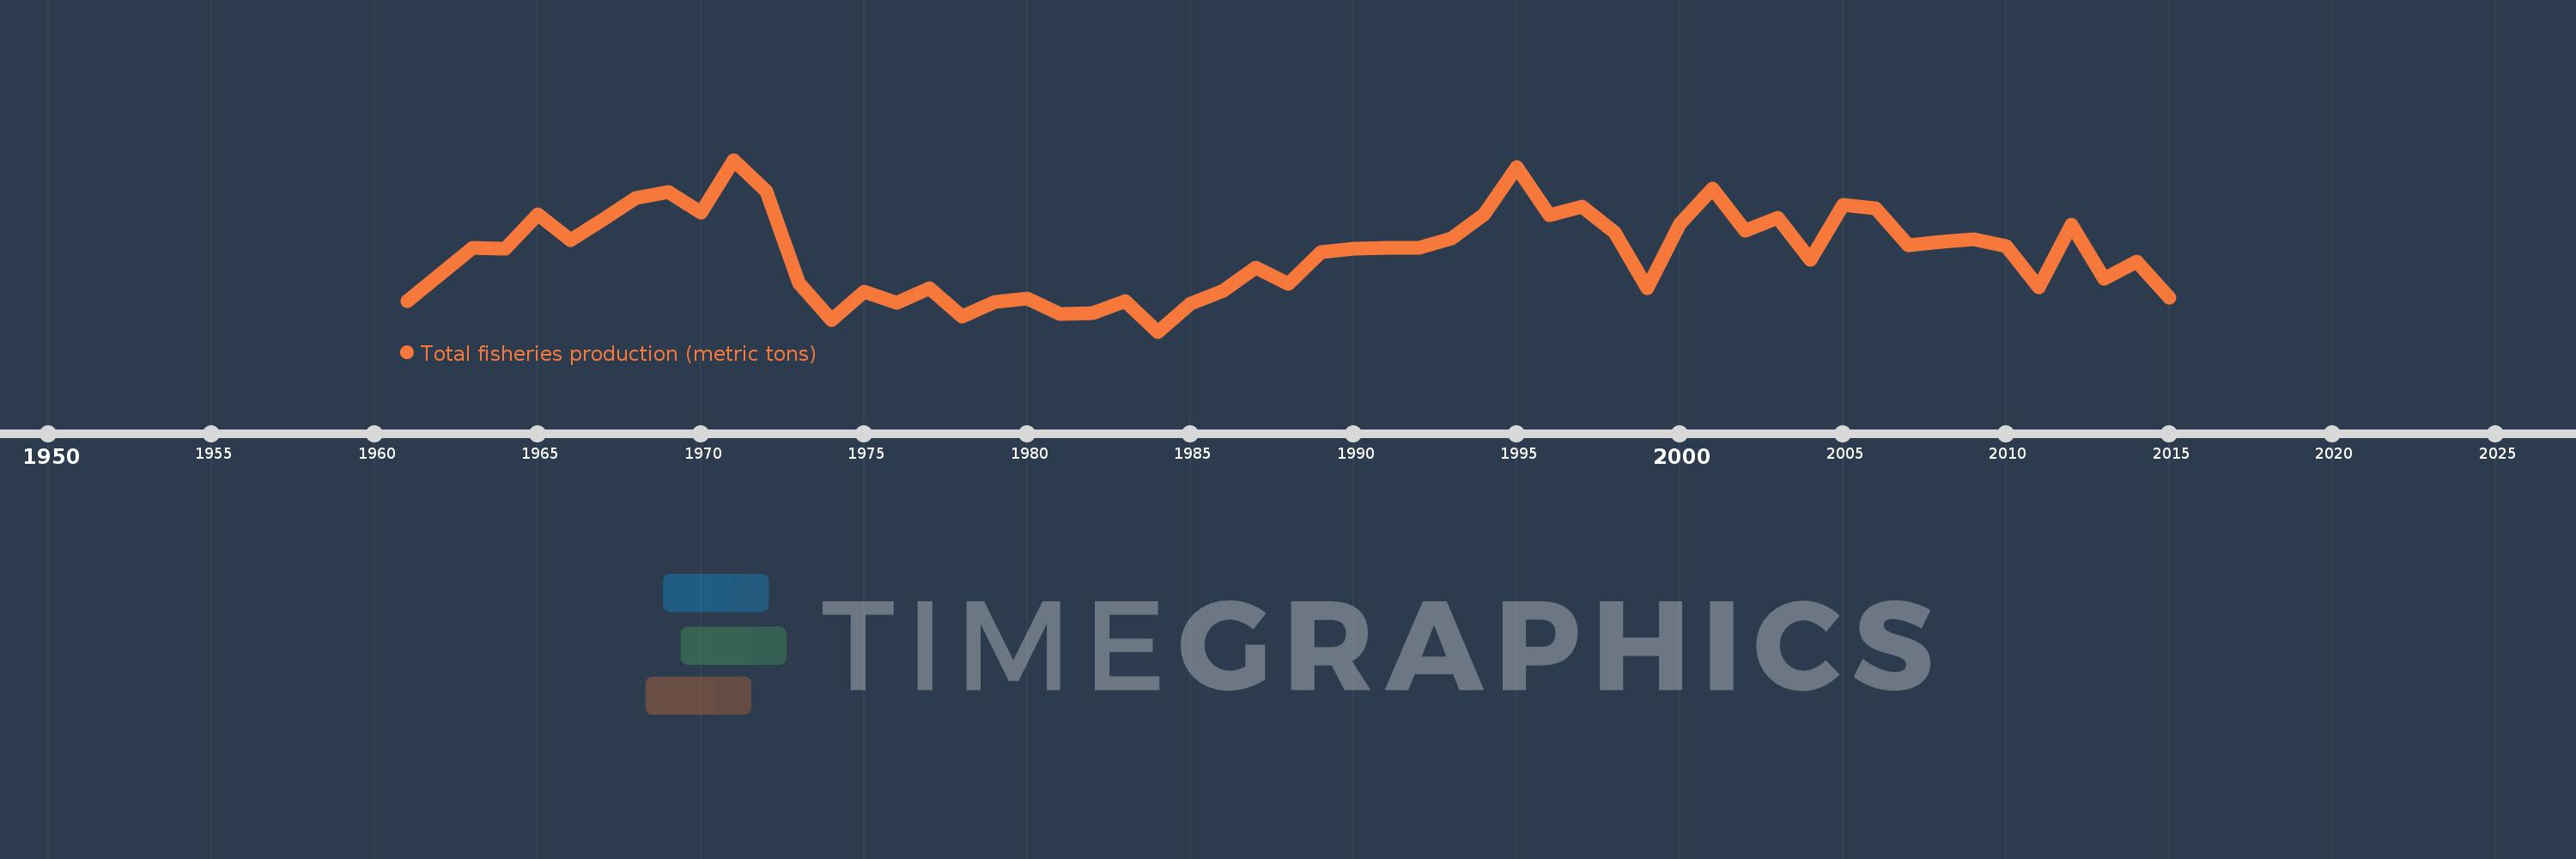
Total fisheries production (metric tons)
2015,2014,2013,2012,2011,2010,2009,2008,2007,2006,2005,2004,2003,2002,2001,2000,1999,1998,1997,1996,1995,1994,1993,1992,1991,1990,1989,1988,1987,1986,1985,1984,1983,1982,1981,1980,1979,1978,1977,1976,1975,1974,1973,1972,1971,1970,1969,1968,1967,1966,1965,1964,1963,1962,1961
Cette statistique dans les autres pays:
AfghanistanAlbaniaAlgeriaAmerican SamoaAngolaAntigua and BarbudaArab WorldArgentinaArmeniaArubaAustraliaAustriaAzerbaijanBahamas, TheBahrainBangladeshBarbadosBelarusBelgiumBelizeBeninBermudaBhutanBoliviaBosnia and HerzegovinaBotswanaBrazilBritish Virgin IslandsBrunei DarussalamBulgariaBurkina FasoBurundiCabo VerdeCambodiaCameroonCanadaCaribbean small statesCayman IslandsCentral African RepublicCentral Europe and the BalticsChadChannel IslandsChileChinaColombiaComorosCongo, Dem. Rep.Congo, Rep.Costa RicaCote d'IvoireCroatiaCubaCuracaoCyprusCzech RepublicDenmarkDjiboutiDominicaDominican RepublicEarly-demographic dividendEast Asia & PacificEast Asia & Pacific (excluding high income)East Asia & Pacific (IDA & IBRD countries)EcuadorEgypt, Arab Rep.El SalvadorEquatorial GuineaEritreaEstoniaEthiopiaEuro areaEurope & Central AsiaEurope & Central Asia (excluding high income)Europe & Central Asia (IDA & IBRD countries)European UnionFaroe IslandsFijiFinlandFragile and conflict affected situationsFranceFrench PolynesiaGabonGambia, TheGeorgiaGermanyGhanaGreeceGreenlandGrenadaGuamGuatemalaGuineaGuinea-BissauGuyanaHaitiHeavily indebted poor countries (HIPC)High incomeHondurasHong Kong SAR, ChinaHungaryIBRD onlyIcelandIDA & IBRD totalIDA blendIDA onlyIDA totalIndiaIndonesiaIran, Islamic Rep.IraqIrelandIsle of ManIsraelItalyJamaicaJapanJordanKazakhstanKenyaKiribatiKorea, Dem. People’s Rep.Korea, Rep.KuwaitKyrgyz RepublicLao PDRLate-demographic dividendLatin America & Caribbean Latin America & Caribbean (excluding high income)Latin America & the Caribbean (IDA & IBRD countries)LatviaLeast developed countries: UN classificationLebanonLesothoLiberiaLibyaLithuaniaLow & middle incomeLow incomeLower middle incomeMacao SAR, ChinaMacedonia, FYRMadagascarMalawiMalaysiaMaldivesMaliMaltaMarshall IslandsMauritaniaMauritiusMexicoMicronesia, Fed. Sts.Middle East & North AfricaMiddle East & North Africa (excluding high income)Middle East & North Africa (IDA & IBRD countries)Middle incomeMoldovaMonacoMongoliaMontenegroMoroccoMozambiqueMyanmarNamibiaNauruNepalNetherlandsNew CaledoniaNew ZealandNicaraguaNigerNigeriaNorth AmericaNorthern Mariana IslandsNorwayOECD membersOmanOther small statesPacific island small statesPakistanPalauPanamaPapua New GuineaParaguayPeruPhilippinesPolandPortugalPost-demographic dividendPre-demographic dividendPuerto RicoQatarRomaniaRussian FederationRwandaSamoaSao Tome and PrincipeSaudi ArabiaSenegalSerbiaSeychellesSierra LeoneSingaporeSint Maarten (Dutch part)Slovak RepublicSloveniaSmall statesSolomon IslandsSomaliaSouth AfricaSouth AsiaSouth Asia (IDA & IBRD)South SudanSpainSri LankaSt. Kitts and NevisSt. LuciaSt. Martin (French part)St. Vincent and the GrenadinesSub-Saharan Africa Sub-Saharan Africa (excluding high income)Sub-Saharan Africa (IDA & IBRD countries)SudanSurinameSwazilandSwedenSwitzerlandSyrian Arab RepublicTajikistanTanzaniaThailandTimor-LesteTogoTongaTrinidad and TobagoTunisiaTurkeyTurkmenistanTurks and Caicos IslandsTuvaluUgandaUkraineUnited Arab EmiratesUnited KingdomUnited StatesUpper middle incomeUruguayUzbekistanVanuatuVenezuela, RBVietnamVirgin Islands (U.S.)West Bank and GazaWorldYemen, Rep.ZambiaZimbabwe La ligne de temps
Cette échelle de temps montre un graphique de 1961 année à 2015 année Peru. Les données jusqu'à 1960 année ne sont pas présentés. Quantité d'observations actuelles selon dates: 55.
Source (désignation):
Les indicateurs du développement mondiale
Source (organisation):
Food and Agriculture Organization.
Catégories:
Environment
Dernière mise à jour
23 avr. 2017
Les indicateurs de changement de valeurs selon les années
Minimum:
1.571 mln.
1 janv. 1984
Maximum:
12.484 mln.
1 janv. 1971
Pour la date d''observation
Valeur
Changement absolu
Le changement par rapport à la valeur précédente
1 janv. 1961
3.503 mln.
+3.503 mln.
0.0%
1 janv. 1962
5.216 mln.
+1.714 mln.
48.93%
1 janv. 1963
6.884 mln.
+1.668 mln.
31.97%
1 janv. 1964
6.822 mln.
-62.3 milles
-0.9%
1 janv. 1965
9.038 mln.
+2.216 mln.
32.48%
1 janv. 1966
7.385 mln.
-1.652 mln.
-18.28%
1 janv. 1967
8.713 mln.
+1.327 mln.
17.97%
1 janv. 1968
10.058 mln.
+1.345 mln.
15.44%
1 janv. 1969
10.444 mln.
+386.705 milles
3.84%
1 janv. 1970
9.148 mln.
-1.297 mln.
-12.42%
1 janv. 1971
12.484 mln.
+3.337 mln.
36.48%
1 janv. 1972
10.507 mln.
-1.977 mln.
-15.84%
1 janv. 1973
4.678 mln.
-5.829 mln.
-55.47%
1 janv. 1974
2.296 mln.
-2.383 mln.
-50.93%
1 janv. 1975
4.126 mln.
+1.83 mln.
79.72%
1 janv. 1976
3.415 mln.
-710.593 milles
-17.22%
1 janv. 1977
4.344 mln.
+928.298 milles
27.18%
1 janv. 1978
2.504 mln.
-1.84 mln.
-42.36%
1 janv. 1979
3.444 mln.
+939.813 milles
37.53%
1 janv. 1980
3.653 mln.
+209.312 milles
6.08%
1 janv. 1981
2.71 mln.
-943.094 milles
-25.82%
1 janv. 1982
2.718 mln.
+8.558 milles
0.32%
1 janv. 1983
3.515 mln.
+796.6 milles
29.3%
1 janv. 1984
1.571 mln.
-1.945 mln.
-55.32%
1 janv. 1985
3.32 mln.
+1.75 mln.
111.41%
1 janv. 1986
4.138 mln.
+818.27 milles
24.65%
1 janv. 1987
5.617 mln.
+1.478 mln.
35.72%
1 janv. 1988
4.588 mln.
-1.029 mln.
-18.32%
1 janv. 1989
6.642 mln.
+2.054 mln.
44.78%
1 janv. 1990
6.854 mln.
+212.238 milles
3.2%
1 janv. 1991
6.874 mln.
+20.051 milles
0.29%
1 janv. 1992
6.905 mln.
+30.699 milles
0.45%
1 janv. 1993
7.508 mln.
+603.19 milles
8.74%
1 janv. 1994
9.01 mln.
+1.502 mln.
20.0%
1 janv. 1995
12.005 mln.
+2.995 mln.
33.25%
1 janv. 1996
8.944 mln.
-3.062 mln.
-25.5%
1 janv. 1997
9.523 mln.
+579.553 milles
6.48%
1 janv. 1998
7.878 mln.
-1.645 mln.
-17.28%
1 janv. 1999
4.353 mln.
-3.525 mln.
-44.74%
1 janv. 2000
8.437 mln.
+4.084 mln.
93.82%
1 janv. 2001
10.665 mln.
+2.228 mln.
26.4%
1 janv. 2002
7.999 mln.
-2.666 mln.
-25.0%
1 janv. 2003
8.783 mln.
+783.634 milles
9.8%
1 janv. 2004
6.108 mln.
-2.675 mln.
-30.46%
1 janv. 2005
9.634 mln.
+3.527 mln.
57.74%
1 janv. 2006
9.419 mln.
-214.59 milles
-2.23%
1 janv. 2007
7.049 mln.
-2.37 mln.
-25.16%
1 janv. 2008
7.261 mln.
+211.543 milles
3.0%
1 janv. 2009
7.451 mln.
+190.576 milles
2.62%
1 janv. 2010
6.978 mln.
-473.665 milles
-6.36%
1 janv. 2011
4.395 mln.
-2.583 mln.
-37.01%
1 janv. 2012
8.347 mln.
+3.952 mln.
89.92%
1 janv. 2013
4.925 mln.
-3.422 mln.
-41.0%
1 janv. 2014
6.002 mln.
+1.077 mln.
21.87%
1 janv. 2015
3.714 mln.
-2.288 mln.
-38.11%
Classement des pays selon les statistiques actuelles par années


Commentaires: