29
/fr/
fr
AIzaSyAYiBZKx7MnpbEhh9jyipgxe19OcubqV5w
April 1, 2024
62807
World
WLD
false
2
1
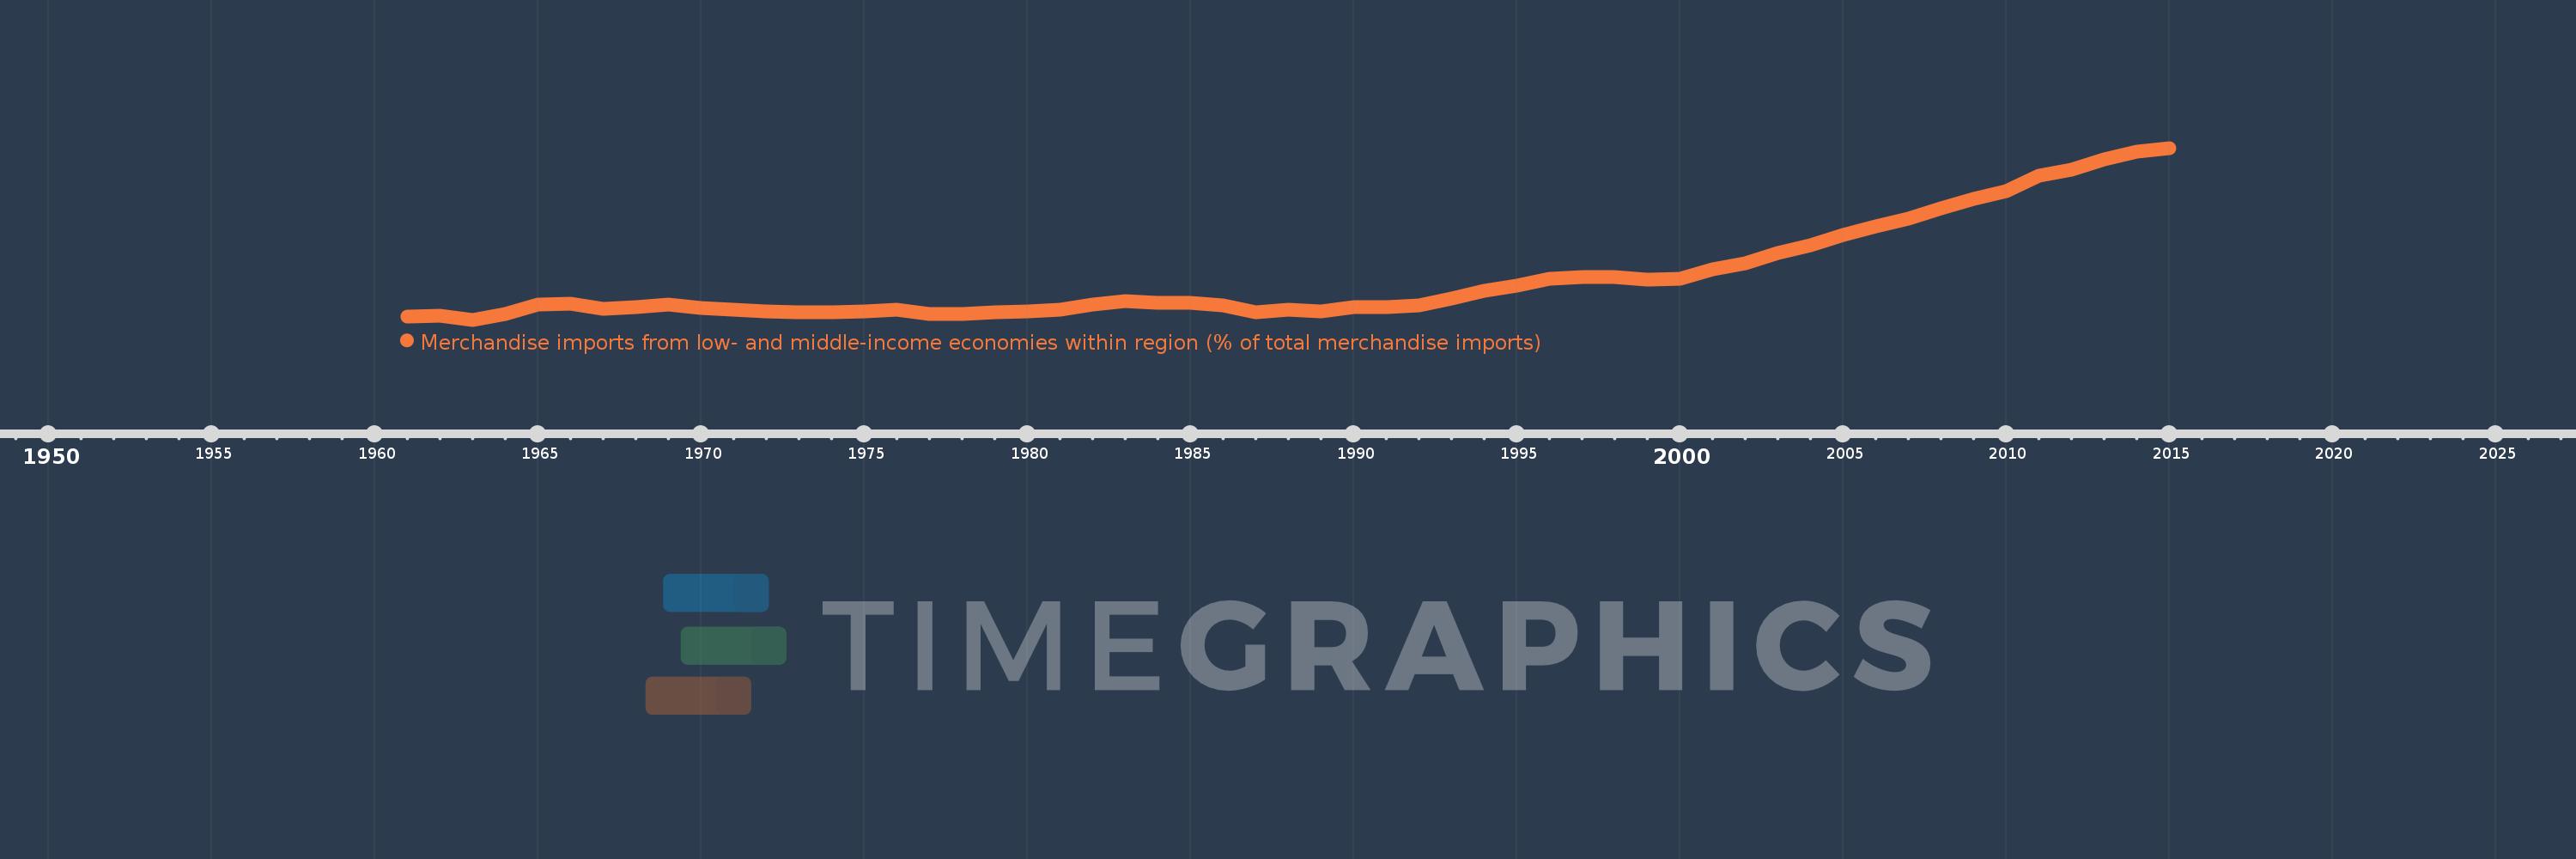
Merchandise imports from low- and middle-income economies within region (% of total merchandise imports)
2015,2014,2013,2012,2011,2010,2009,2008,2007,2006,2005,2004,2003,2002,2001,2000,1999,1998,1997,1996,1995,1994,1993,1992,1991,1990,1989,1988,1987,1986,1985,1984,1983,1982,1981,1980,1979,1978,1977,1976,1975,1974,1973,1972,1971,1970,1969,1968,1967,1966,1965,1964,1963,1962,1961
Cette statistique dans les autres pays:
La ligne de temps
Cette échelle de temps montre un graphique de 1961 année à 2015 année World. Les données jusqu'à 1960 année ne sont pas présentés. Quantité d'observations actuelles selon dates: 55.
Source (désignation):
Les indicateurs du développement mondiale
Source (organisation):
World Bank staff estimates based data from International Monetary Fund's Direction of Trade database.
Catégories:
Private Sector, Trade
Dernière mise à jour
23 avr. 2017
Les indicateurs de changement de valeurs selon les années
Minimum:
0.462
1 janv. 1963
Maximum:
4.161
1 janv. 2015
Pour la date d''observation
Valeur
Changement absolu
Le changement par rapport à la valeur précédente
1 janv. 1961
0.531
+0.531
0.0%
1 janv. 1962
0.543
+0.012
2.29%
1 janv. 1963
0.462
-0.081
-14.96%
1 janv. 1964
0.585
+0.123
26.65%
1 janv. 1965
0.783
+0.198
33.92%
1 janv. 1966
0.802
+0.019
2.39%
1 janv. 1967
0.7
-0.102
-12.72%
1 janv. 1968
0.742
+0.042
6.04%
1 janv. 1969
0.789
+0.047
6.29%
1 janv. 1970
0.717
-0.073
-9.2%
1 janv. 1971
0.685
-0.031
-4.34%
1 janv. 1972
0.645
-0.04
-5.9%
1 janv. 1973
0.629
-0.016
-2.45%
1 janv. 1974
0.632
+0.003
0.51%
1 janv. 1975
0.635
+0.003
0.48%
1 janv. 1976
0.68
+0.044
7.0%
1 janv. 1977
0.591
-0.089
-13.12%
1 janv. 1978
0.583
-0.007
-1.25%
1 janv. 1979
0.619
+0.036
6.2%
1 janv. 1980
0.633
+0.014
2.26%
1 janv. 1981
0.677
+0.043
6.84%
1 janv. 1982
0.794
+0.118
17.38%
1 janv. 1983
0.867
+0.073
9.13%
1 janv. 1984
0.826
-0.041
-4.75%
1 janv. 1985
0.827
+0.002
0.19%
1 janv. 1986
0.771
-0.057
-6.83%
1 janv. 1987
0.63
-0.14
-18.2%
1 janv. 1988
0.677
+0.047
7.44%
1 janv. 1989
0.649
-0.029
-4.21%
1 janv. 1990
0.739
+0.09
13.82%
1 janv. 1991
0.731
-0.007
-0.98%
1 janv. 1992
0.77
+0.039
5.34%
1 janv. 1993
0.915
+0.145
18.79%
1 janv. 1994
1.083
+0.168
18.34%
1 janv. 1995
1.188
+0.105
9.74%
1 janv. 1996
1.353
+0.165
13.86%
1 janv. 1997
1.376
+0.023
1.66%
1 janv. 1998
1.388
+0.013
0.92%
1 janv. 1999
1.333
-0.055
-3.98%
1 janv. 2000
1.351
+0.018
1.37%
1 janv. 2001
1.549
+0.197
14.61%
1 janv. 2002
1.676
+0.127
8.2%
1 janv. 2003
1.899
+0.224
13.35%
1 janv. 2004
2.06
+0.161
8.47%
1 janv. 2005
2.295
+0.235
11.39%
1 janv. 2006
2.473
+0.178
7.77%
1 janv. 2007
2.63
+0.157
6.35%
1 janv. 2008
2.856
+0.226
8.6%
1 janv. 2009
3.061
+0.204
7.15%
1 janv. 2010
3.236
+0.175
5.72%
1 janv. 2011
3.566
+0.33
10.2%
1 janv. 2012
3.691
+0.125
3.51%
1 janv. 2013
3.917
+0.226
6.12%
1 janv. 2014
4.088
+0.17
4.35%
1 janv. 2015
4.161
+0.074
1.8%
Classement des pays selon les statistiques actuelles par années


Commentaires: