29
/fr/
fr
AIzaSyAYiBZKx7MnpbEhh9jyipgxe19OcubqV5w
April 1, 2024
30905
Europe & Central Asia
ECS
false
2
1
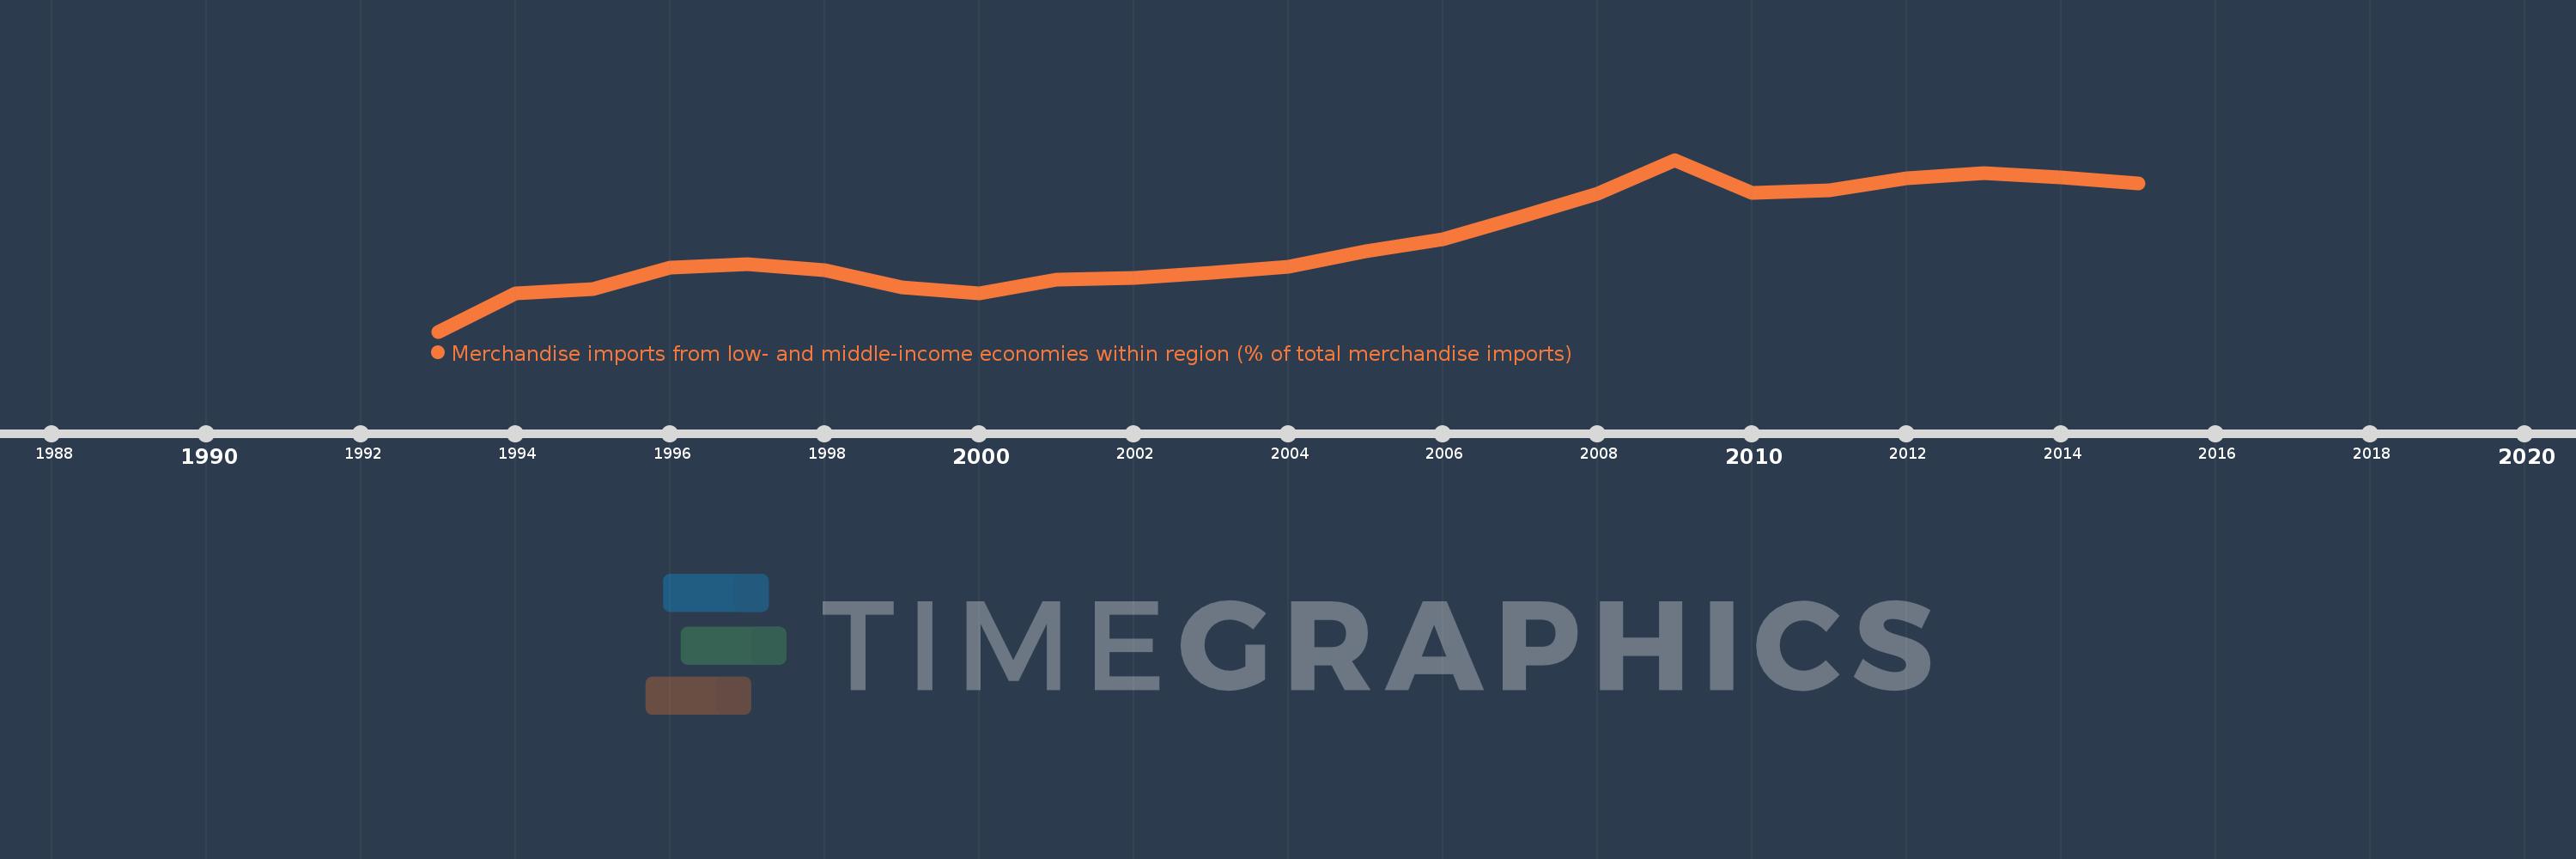
Merchandise imports from low- and middle-income economies within region (% of total merchandise imports)
2015,2014,2013,2012,2011,2010,2009,2008,2007,2006,2005,2004,2003,2002,2001,2000,1999,1998,1997,1996,1995,1994,1993
Cette statistique dans les autres pays:
La ligne de temps
Cette échelle de temps montre un graphique de 1993 année à 2015 année Europe & Central Asia. Les données jusqu'à 1992 année ne sont pas présentés. Quantité d'observations actuelles selon dates: 23.
Source (désignation):
Les indicateurs du développement mondiale
Source (organisation):
World Bank staff estimates based data from International Monetary Fund's Direction of Trade database.
Catégories:
Private Sector, Trade
Dernière mise à jour
23 avr. 2017
Les indicateurs de changement de valeurs selon les années
Minimum:
0.102
1 janv. 1993
Pour la date d''observation
Valeur
Changement absolu
Le changement par rapport à la valeur précédente
1 janv. 1993
0.102
+0.102
0.0%
1 janv. 1994
0.34
+0.238
232.4%
1 janv. 1995
0.362
+0.022
6.34%
1 janv. 1996
0.495
+0.134
36.94%
1 janv. 1997
0.516
+0.02
4.11%
1 janv. 1998
0.48
-0.036
-6.94%
1 janv. 1999
0.375
-0.105
-21.82%
1 janv. 2000
0.339
-0.036
-9.58%
1 janv. 2001
0.423
+0.084
24.64%
1 janv. 2002
0.435
+0.012
2.75%
1 janv. 2003
0.463
+0.028
6.52%
1 janv. 2004
0.499
+0.036
7.87%
1 janv. 2005
0.595
+0.095
19.13%
1 janv. 2006
0.673
+0.079
13.2%
1 janv. 2007
0.809
+0.136
20.22%
1 janv. 2008
0.951
+0.141
17.46%
1 janv. 2009
1.16
+0.21
22.05%
1 janv. 2010
0.956
-0.204
-17.6%
1 janv. 2011
0.972
+0.016
1.67%
1 janv. 2012
1.047
+0.075
7.72%
1 janv. 2013
1.078
+0.03
2.91%
1 janv. 2014
1.054
-0.023
-2.17%
1 janv. 2015
1.016
-0.038
-3.6%
Classement des pays selon les statistiques actuelles par années


Commentaires: