29
/fr/
fr
AIzaSyAYiBZKx7MnpbEhh9jyipgxe19OcubqV5w
April 1, 2024
48327
Middle East & North Africa
MEA
false
2
1
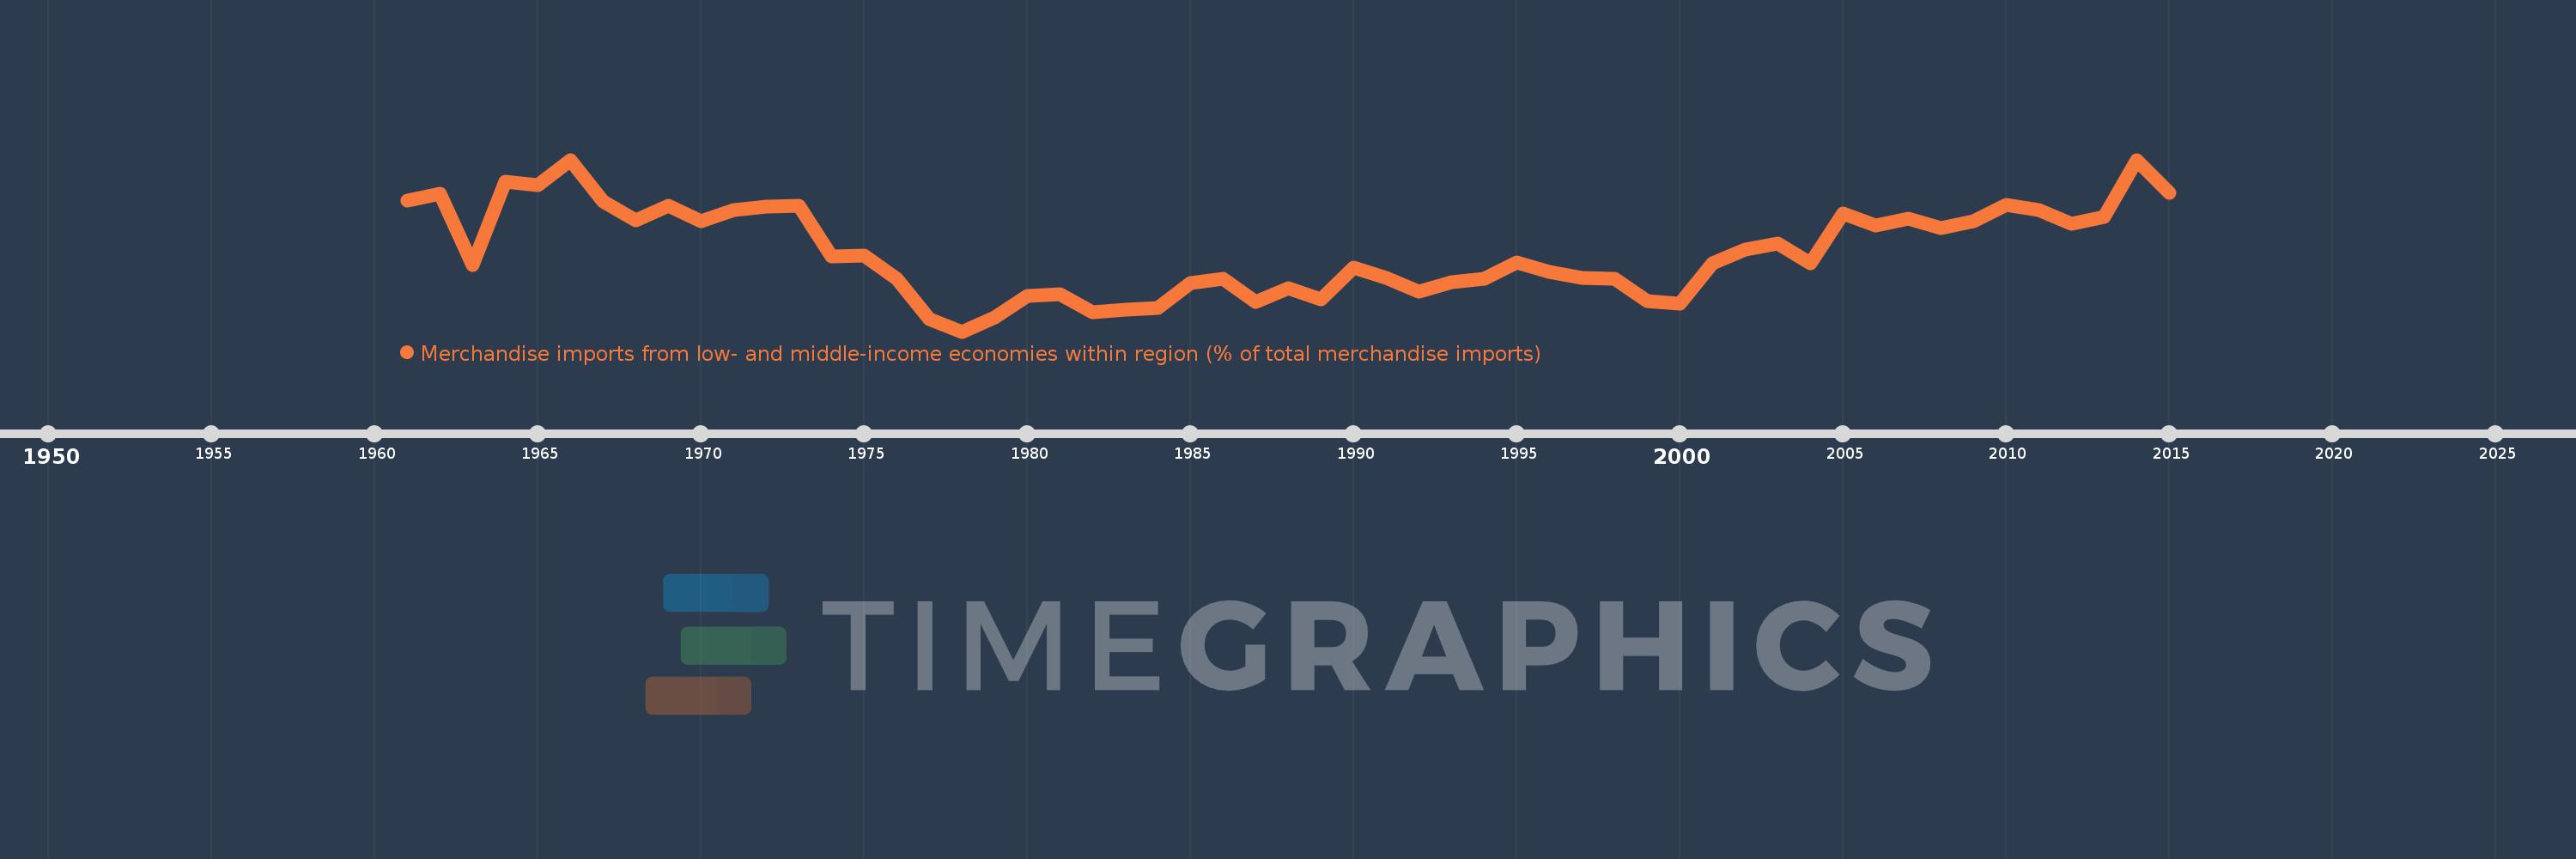
Merchandise imports from low- and middle-income economies within region (% of total merchandise imports)
2015,2014,2013,2012,2011,2010,2009,2008,2007,2006,2005,2004,2003,2002,2001,2000,1999,1998,1997,1996,1995,1994,1993,1992,1991,1990,1989,1988,1987,1986,1985,1984,1983,1982,1981,1980,1979,1978,1977,1976,1975,1974,1973,1972,1971,1970,1969,1968,1967,1966,1965,1964,1963,1962,1961
Cette statistique dans les autres pays:
La ligne de temps
Cette échelle de temps montre un graphique de 1961 année à 2015 année Middle East & North Africa. Les données jusqu'à 1960 année ne sont pas présentés. Quantité d'observations actuelles selon dates: 55.
Source (désignation):
Les indicateurs du développement mondiale
Source (organisation):
World Bank staff estimates based data from International Monetary Fund's Direction of Trade database.
Catégories:
Private Sector, Trade
Dernière mise à jour
23 avr. 2017
Les indicateurs de changement de valeurs selon les années
Minimum:
0.916
1 janv. 1978
Maximum:
4.302
1 janv. 1966
Pour la date d''observation
Valeur
Changement absolu
Le changement par rapport à la valeur précédente
1 janv. 1961
3.503
+3.503
0.0%
1 janv. 1962
3.637
+0.135
3.84%
1 janv. 1963
2.23
-1.407
-38.68%
1 janv. 1964
3.877
+1.646
73.82%
1 janv. 1965
3.807
-0.07
-1.8%
1 janv. 1966
4.302
+0.495
13.01%
1 janv. 1967
3.483
-0.819
-19.04%
1 janv. 1968
3.105
-0.378
-10.86%
1 janv. 1969
3.404
+0.299
9.62%
1 janv. 1970
3.085
-0.319
-9.36%
1 janv. 1971
3.305
+0.22
7.12%
1 janv. 1972
3.38
+0.075
2.26%
1 janv. 1973
3.392
+0.013
0.38%
1 janv. 1974
2.392
-1.0
-29.49%
1 janv. 1975
2.416
+0.024
1.02%
1 janv. 1976
1.95
-0.466
-19.28%
1 janv. 1977
1.165
-0.786
-40.28%
1 janv. 1978
0.916
-0.249
-21.36%
1 janv. 1979
1.195
+0.279
30.49%
1 janv. 1980
1.626
+0.431
36.04%
1 janv. 1981
1.644
+0.018
1.11%
1 janv. 1982
1.304
-0.34
-20.68%
1 janv. 1983
1.355
+0.051
3.88%
1 janv. 1984
1.374
+0.019
1.41%
1 janv. 1985
1.878
+0.504
36.71%
1 janv. 1986
1.95
+0.072
3.83%
1 janv. 1987
1.498
-0.452
-23.18%
1 janv. 1988
1.771
+0.273
18.22%
1 janv. 1989
1.553
-0.218
-12.3%
1 janv. 1990
2.171
+0.618
39.83%
1 janv. 1991
1.979
-0.192
-8.85%
1 janv. 1992
1.695
-0.284
-14.36%
1 janv. 1993
1.892
+0.197
11.62%
1 janv. 1994
1.961
+0.069
3.66%
1 janv. 1995
2.279
+0.318
16.23%
1 janv. 1996
2.089
-0.19
-8.35%
1 janv. 1997
1.97
-0.119
-5.71%
1 janv. 1998
1.957
-0.013
-0.67%
1 janv. 1999
1.511
-0.446
-22.78%
1 janv. 2000
1.468
-0.043
-2.82%
1 janv. 2001
2.262
+0.794
54.07%
1 janv. 2002
2.528
+0.266
11.75%
1 janv. 2003
2.655
+0.127
5.01%
1 janv. 2004
2.262
-0.393
-14.8%
1 janv. 2005
3.248
+0.986
43.61%
1 janv. 2006
3.009
-0.239
-7.35%
1 janv. 2007
3.149
+0.14
4.65%
1 janv. 2008
2.961
-0.188
-5.97%
1 janv. 2009
3.092
+0.131
4.41%
1 janv. 2010
3.406
+0.314
10.16%
1 janv. 2011
3.306
-0.101
-2.95%
1 janv. 2012
3.039
-0.267
-8.07%
1 janv. 2013
3.181
+0.143
4.69%
1 janv. 2014
4.293
+1.112
34.94%
1 janv. 2015
3.646
-0.647
-15.06%
Classement des pays selon les statistiques actuelles par années


Commentaires: