29
/fr/
fr
AIzaSyAYiBZKx7MnpbEhh9jyipgxe19OcubqV5w
April 1, 2024
62421
World
WLD
false
2
1
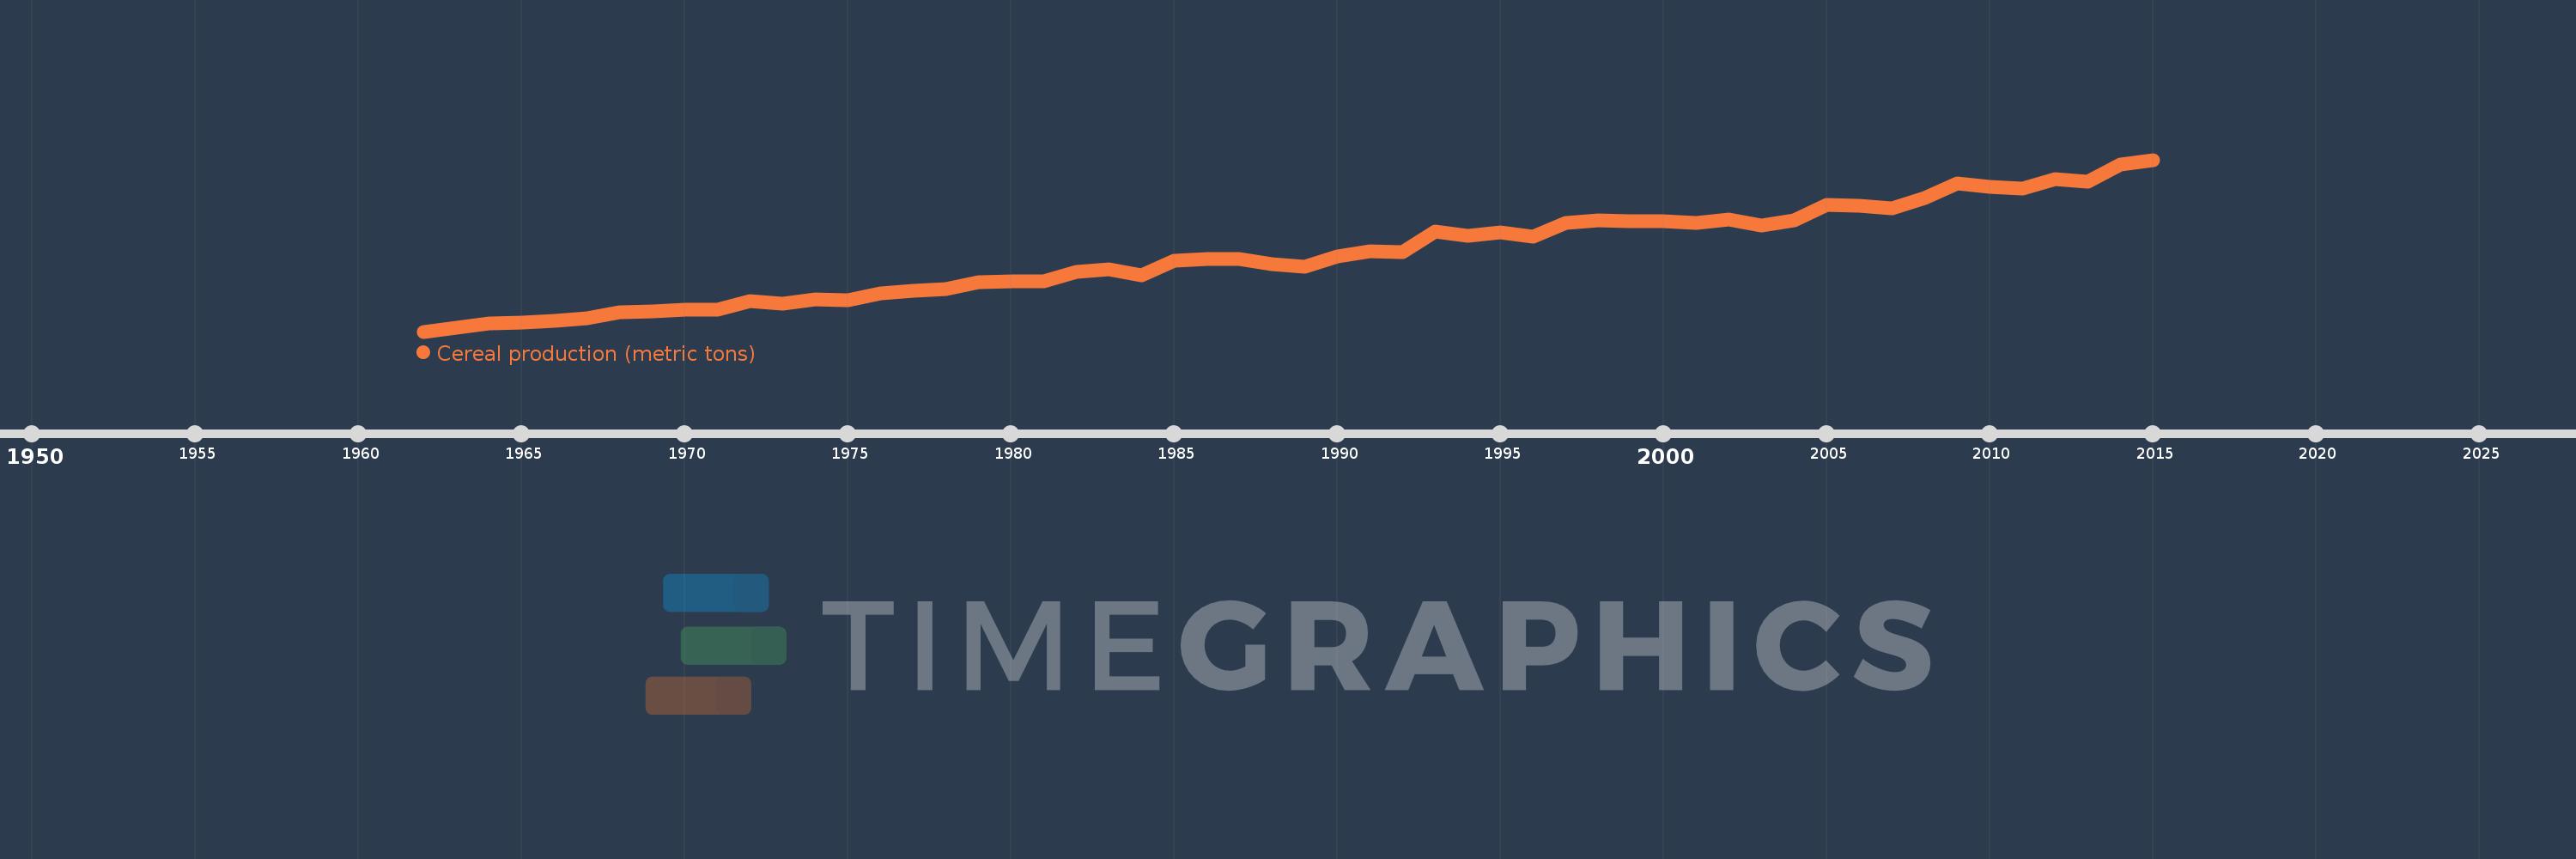
Cereal production (metric tons)
2015,2014,2013,2012,2011,2010,2009,2008,2007,2006,2005,2004,2003,2002,2001,2000,1999,1998,1997,1996,1995,1994,1993,1992,1991,1990,1989,1988,1987,1986,1985,1984,1983,1982,1981,1980,1979,1978,1977,1976,1975,1974,1973,1972,1971,1970,1969,1968,1967,1966,1965,1964,1963,1962
Cette statistique dans les autres pays:
AfghanistanAlbaniaAlgeriaAngolaAntigua and BarbudaArab WorldArgentinaArmeniaAustraliaAustriaAzerbaijanBahamas, TheBangladeshBarbadosBelarusBelgiumBelizeBeninBhutanBoliviaBosnia and HerzegovinaBotswanaBrazilBrunei DarussalamBulgariaBurkina FasoBurundiCabo VerdeCambodiaCameroonCanadaCaribbean small statesCentral African RepublicCentral Europe and the BalticsChadChileChinaColombiaComorosCongo, Dem. Rep.Congo, Rep.Costa RicaCote d'IvoireCroatiaCubaCyprusCzech RepublicDenmarkDjiboutiDominicaDominican RepublicEarly-demographic dividendEast Asia & PacificEast Asia & Pacific (excluding high income)East Asia & Pacific (IDA & IBRD countries)EcuadorEgypt, Arab Rep.El SalvadorEritreaEstoniaEthiopiaEuro areaEurope & Central AsiaEurope & Central Asia (excluding high income)Europe & Central Asia (IDA & IBRD countries)European UnionFijiFinlandFragile and conflict affected situationsFranceGabonGambia, TheGeorgiaGermanyGhanaGreeceGrenadaGuamGuatemalaGuineaGuinea-BissauGuyanaHaitiHeavily indebted poor countries (HIPC)High incomeHondurasHong Kong SAR, ChinaHungaryIBRD onlyIDA & IBRD totalIDA blendIDA onlyIDA totalIndiaIndonesiaIran, Islamic Rep.IraqIrelandIsraelItalyJamaicaJapanJordanKazakhstanKenyaKorea, Dem. People’s Rep.Korea, Rep.KuwaitKyrgyz RepublicLao PDRLate-demographic dividendLatin America & Caribbean Latin America & Caribbean (excluding high income)Latin America & the Caribbean (IDA & IBRD countries)LatviaLeast developed countries: UN classificationLebanonLesothoLiberiaLibyaLithuaniaLow & middle incomeLow incomeLower middle incomeLuxembourgMacedonia, FYRMadagascarMalawiMalaysiaMaldivesMaliMaltaMauritaniaMauritiusMexicoMicronesia, Fed. Sts.Middle East & North AfricaMiddle East & North Africa (excluding high income)Middle East & North Africa (IDA & IBRD countries)Middle incomeMoldovaMongoliaMontenegroMoroccoMozambiqueMyanmarNamibiaNepalNetherlandsNew CaledoniaNew ZealandNicaraguaNigerNigeriaNorth AmericaNorwayOECD membersOmanOther small statesPacific island small statesPakistanPanamaPapua New GuineaParaguayPeruPhilippinesPolandPortugalPost-demographic dividendPre-demographic dividendPuerto RicoQatarRomaniaRussian FederationRwandaSao Tome and PrincipeSaudi ArabiaSenegalSerbiaSierra LeoneSlovak RepublicSloveniaSmall statesSolomon IslandsSomaliaSouth AfricaSouth AsiaSouth Asia (IDA & IBRD)South SudanSpainSri LankaSt. LuciaSt. Vincent and the GrenadinesSub-Saharan Africa Sub-Saharan Africa (excluding high income)Sub-Saharan Africa (IDA & IBRD countries)SudanSurinameSwazilandSwedenSwitzerlandSyrian Arab RepublicTajikistanTanzaniaThailandTimor-LesteTogoTrinidad and TobagoTunisiaTurkeyTurkmenistanUgandaUkraineUnited Arab EmiratesUnited KingdomUnited StatesUpper middle incomeUruguayUzbekistanVanuatuVenezuela, RBVietnamWest Bank and GazaWorldYemen, Rep.ZambiaZimbabwe La ligne de temps
Cette échelle de temps montre un graphique de 1962 année à 2015 année World. Les données jusqu'à 1961 année ne sont pas présentés. Quantité d'observations actuelles selon dates: 54.
Source (désignation):
Les indicateurs du développement mondiale
Source (organisation):
Food and Agriculture Organization, electronic files and web site.
Catégories:
Agriculture & Rural Development
Dernière mise à jour
23 avr. 2017
Les indicateurs de changement de valeurs selon les années
Minimum:
741.458 mln.
1 janv. 1962
Maximum:
2.819 mds
1 janv. 2015
Pour la date d''observation
Valeur
Changement absolu
Le changement par rapport à la valeur précédente
1 janv. 1962
741.458 mln.
+741.458 mln.
0.0%
1 janv. 1963
791.506 mln.
+50.048 mln.
6.75%
1 janv. 1964
837.944 mln.
+46.438 mln.
5.87%
1 janv. 1965
850.142 mln.
+12.198 mln.
1.46%
1 janv. 1966
873.927 mln.
+23.786 mln.
2.8%
1 janv. 1967
903.601 mln.
+29.674 mln.
3.4%
1 janv. 1968
970.231 mln.
+66.63 mln.
7.37%
1 janv. 1969
987.687 mln.
+17.456 mln.
1.8%
1 janv. 1970
1.003 mds
+15.495 mln.
1.57%
1 janv. 1971
1.005 mds
+1.711 mln.
0.17%
1 janv. 1972
1.112 mds
+107.406 mln.
10.69%
1 janv. 1973
1.084 mds
-28.631 mln.
-2.57%
1 janv. 1974
1.134 mds
+50.701 mln.
4.68%
1 janv. 1975
1.124 mds
-10.2 mln.
-0.9%
1 janv. 1976
1.208 mds
+84.177 mln.
7.49%
1 janv. 1977
1.236 mds
+28.126 mln.
2.33%
1 janv. 1978
1.252 mds
+15.725 mln.
1.27%
1 janv. 1979
1.341 mds
+89.06 mln.
7.11%
1 janv. 1980
1.348 mds
+6.25 mln.
0.47%
1 janv. 1981
1.351 mds
+3.624 mln.
0.27%
1 janv. 1982
1.462 mds
+110.839 mln.
8.2%
1 janv. 1983
1.493 mds
+31.261 mln.
2.14%
1 janv. 1984
1.424 mds
-69.326 mln.
-4.64%
1 janv. 1985
1.601 mds
+177.408 mln.
12.46%
1 janv. 1986
1.622 mds
+20.355 mln.
1.27%
1 janv. 1987
1.615 mds
-6.293 mln.
-0.39%
1 janv. 1988
1.558 mds
-57.807 mln.
-3.58%
1 janv. 1989
1.526 mds
-31.423 mln.
-2.02%
1 janv. 1990
1.653 mds
+126.578 mln.
8.29%
1 janv. 1991
1.714 mds
+60.95 mln.
3.69%
1 janv. 1992
1.702 mds
-12.161 mln.
-0.71%
1 janv. 1993
1.955 mds
+252.992 mln.
14.87%
1 janv. 1994
1.896 mds
-58.813 mln.
-3.01%
1 janv. 1995
1.945 mds
+48.91 mln.
2.58%
1 janv. 1996
1.888 mds
-56.323 mln.
-2.9%
1 janv. 1997
2.056 mds
+167.475 mln.
8.87%
1 janv. 1998
2.084 mds
+28.341 mln.
1.38%
1 janv. 1999
2.076 mds
-8.327 mln.
-0.4%
1 janv. 2000
2.071 mds
-4.33 mln.
-0.21%
1 janv. 2001
2.054 mds
-17.162 mln.
-0.83%
1 janv. 2002
2.102 mds
+47.485 mln.
2.31%
1 janv. 2003
2.026 mds
-75.939 mln.
-3.61%
1 janv. 2004
2.084 mds
+57.921 mln.
2.86%
1 janv. 2005
2.268 mds
+184.671 mln.
8.86%
1 janv. 2006
2.262 mds
-6.449 mln.
-0.28%
1 janv. 2007
2.234 mds
-28.323 mln.
-1.25%
1 janv. 2008
2.354 mds
+120.546 mln.
5.4%
1 janv. 2009
2.535 mds
+180.362 mln.
7.66%
1 janv. 2010
2.496 mds
-38.745 mln.
-1.53%
1 janv. 2011
2.468 mds
-27.345 mln.
-1.1%
1 janv. 2012
2.584 mds
+115.913 mln.
4.7%
1 janv. 2013
2.558 mds
-26.382 mln.
-1.02%
1 janv. 2014
2.763 mds
+205.28 mln.
8.03%
1 janv. 2015
2.819 mds
+55.24 mln.
2.0%
Classement des pays selon les statistiques actuelles par années


Commentaires: