29
/fr/
fr
AIzaSyAYiBZKx7MnpbEhh9jyipgxe19OcubqV5w
April 1, 2024
34794
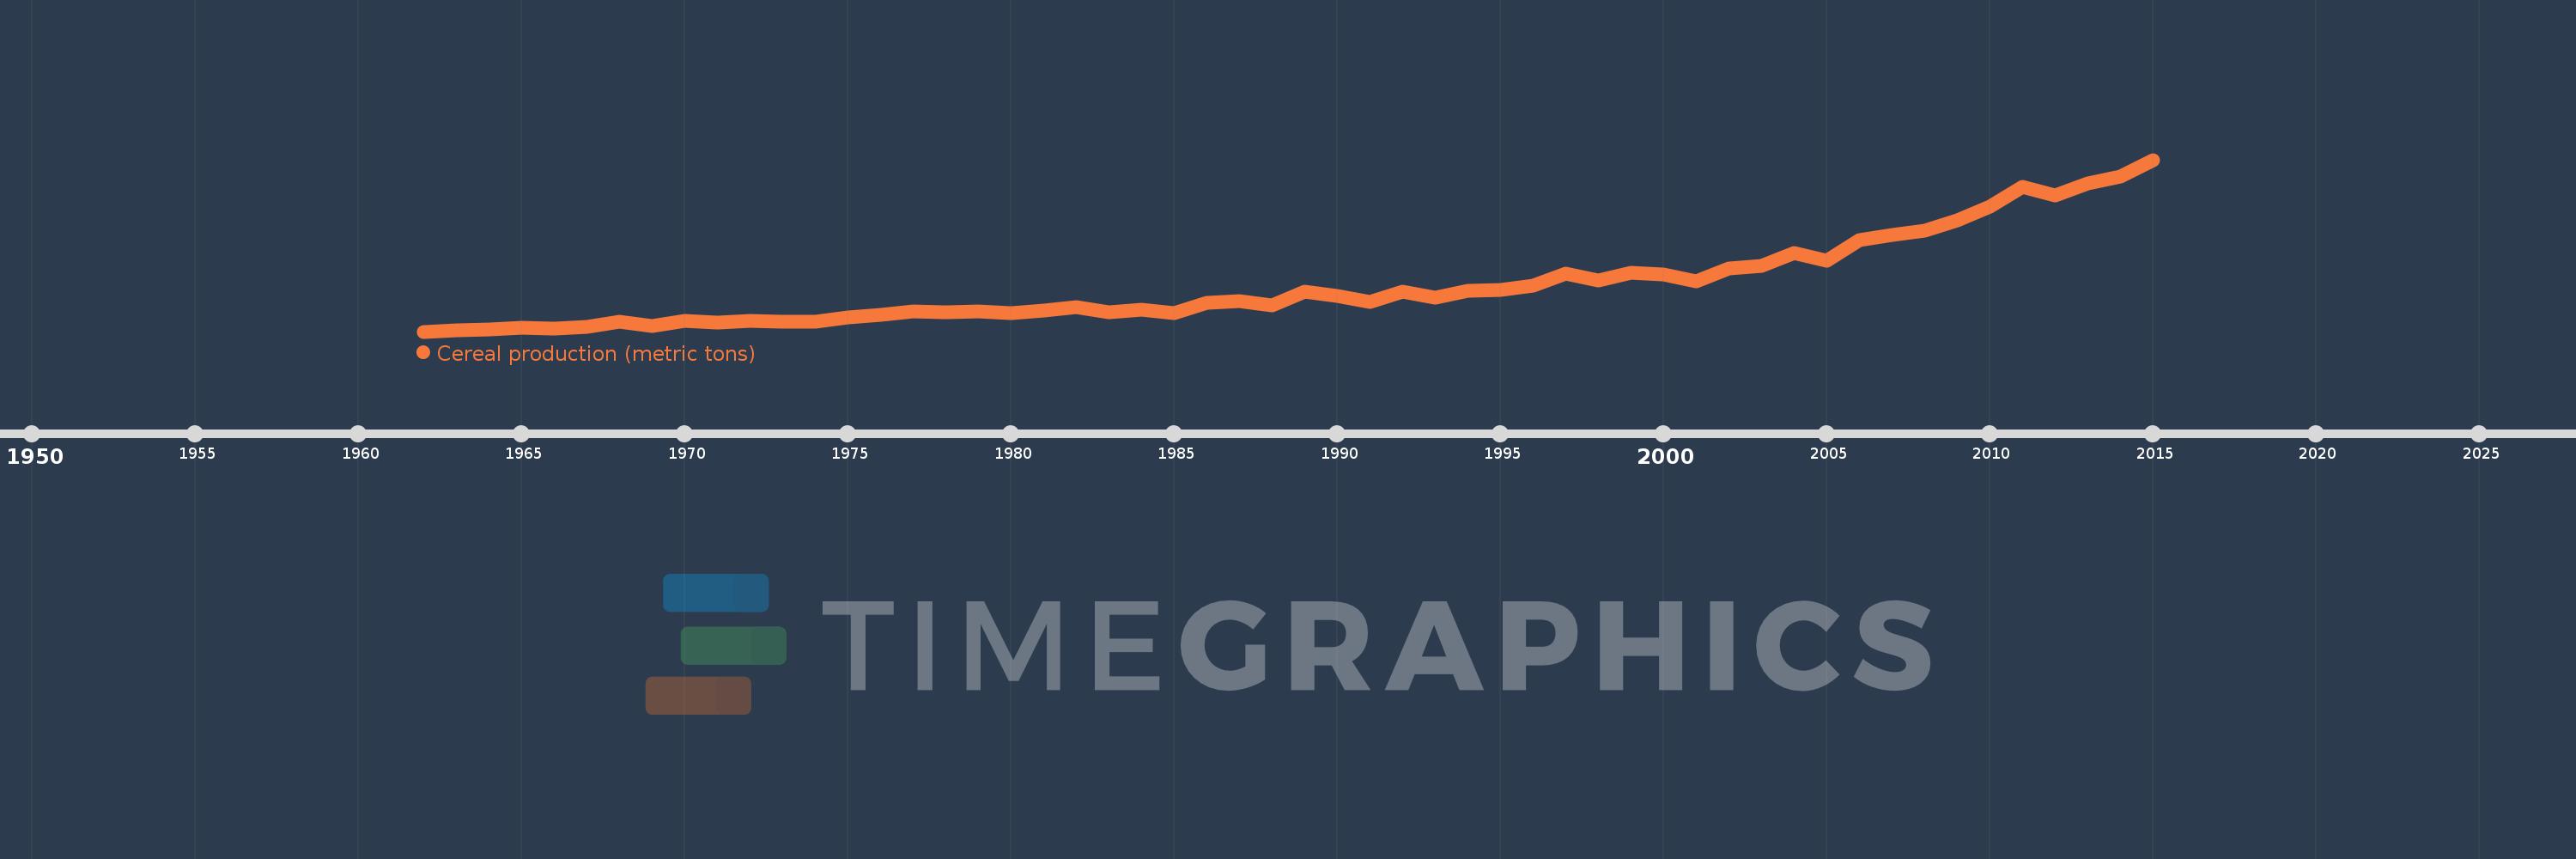
Heavily indebted poor countries (HIPC)
HPC
false
2
1
Cereal production (metric tons)
2015,2014,2013,2012,2011,2010,2009,2008,2007,2006,2005,2004,2003,2002,2001,2000,1999,1998,1997,1996,1995,1994,1993,1992,1991,1990,1989,1988,1987,1986,1985,1984,1983,1982,1981,1980,1979,1978,1977,1976,1975,1974,1973,1972,1971,1970,1969,1968,1967,1966,1965,1964,1963,1962
Cette statistique dans les autres pays:
AfghanistanAlbaniaAlgeriaAngolaAntigua and BarbudaArab WorldArgentinaArmeniaAustraliaAustriaAzerbaijanBahamas, TheBangladeshBarbadosBelarusBelgiumBelizeBeninBhutanBoliviaBosnia and HerzegovinaBotswanaBrazilBrunei DarussalamBulgariaBurkina FasoBurundiCabo VerdeCambodiaCameroonCanadaCaribbean small statesCentral African RepublicCentral Europe and the BalticsChadChileChinaColombiaComorosCongo, Dem. Rep.Congo, Rep.Costa RicaCote d'IvoireCroatiaCubaCyprusCzech RepublicDenmarkDjiboutiDominicaDominican RepublicEarly-demographic dividendEast Asia & PacificEast Asia & Pacific (excluding high income)East Asia & Pacific (IDA & IBRD countries)EcuadorEgypt, Arab Rep.El SalvadorEritreaEstoniaEthiopiaEuro areaEurope & Central AsiaEurope & Central Asia (excluding high income)Europe & Central Asia (IDA & IBRD countries)European UnionFijiFinlandFragile and conflict affected situationsFranceGabonGambia, TheGeorgiaGermanyGhanaGreeceGrenadaGuamGuatemalaGuineaGuinea-BissauGuyanaHaitiHeavily indebted poor countries (HIPC)High incomeHondurasHong Kong SAR, ChinaHungaryIBRD onlyIDA & IBRD totalIDA blendIDA onlyIDA totalIndiaIndonesiaIran, Islamic Rep.IraqIrelandIsraelItalyJamaicaJapanJordanKazakhstanKenyaKorea, Dem. People’s Rep.Korea, Rep.KuwaitKyrgyz RepublicLao PDRLate-demographic dividendLatin America & Caribbean Latin America & Caribbean (excluding high income)Latin America & the Caribbean (IDA & IBRD countries)LatviaLeast developed countries: UN classificationLebanonLesothoLiberiaLibyaLithuaniaLow & middle incomeLow incomeLower middle incomeLuxembourgMacedonia, FYRMadagascarMalawiMalaysiaMaldivesMaliMaltaMauritaniaMauritiusMexicoMicronesia, Fed. Sts.Middle East & North AfricaMiddle East & North Africa (excluding high income)Middle East & North Africa (IDA & IBRD countries)Middle incomeMoldovaMongoliaMontenegroMoroccoMozambiqueMyanmarNamibiaNepalNetherlandsNew CaledoniaNew ZealandNicaraguaNigerNigeriaNorth AmericaNorwayOECD membersOmanOther small statesPacific island small statesPakistanPanamaPapua New GuineaParaguayPeruPhilippinesPolandPortugalPost-demographic dividendPre-demographic dividendPuerto RicoQatarRomaniaRussian FederationRwandaSao Tome and PrincipeSaudi ArabiaSenegalSerbiaSierra LeoneSlovak RepublicSloveniaSmall statesSolomon IslandsSomaliaSouth AfricaSouth AsiaSouth Asia (IDA & IBRD)South SudanSpainSri LankaSt. LuciaSt. Vincent and the GrenadinesSub-Saharan Africa Sub-Saharan Africa (excluding high income)Sub-Saharan Africa (IDA & IBRD countries)SudanSurinameSwazilandSwedenSwitzerlandSyrian Arab RepublicTajikistanTanzaniaThailandTimor-LesteTogoTrinidad and TobagoTunisiaTurkeyTurkmenistanUgandaUkraineUnited Arab EmiratesUnited KingdomUnited StatesUpper middle incomeUruguayUzbekistanVanuatuVenezuela, RBVietnamWest Bank and GazaWorldYemen, Rep.ZambiaZimbabwe La ligne de temps
Cette échelle de temps montre un graphique de 1962 année à 2015 année Heavily indebted poor countries (HIPC). Les données jusqu'à 1961 année ne sont pas présentés. Quantité d'observations actuelles selon dates: 54.
Source (désignation):
Les indicateurs du développement mondiale
Source (organisation):
Food and Agriculture Organization, electronic files and web site.
Catégories:
Agriculture & Rural Development
Dernière mise à jour
23 avr. 2017
Les indicateurs de changement de valeurs selon les années
Minimum:
25.309 mln.
1 janv. 1962
Maximum:
112.953 mln.
1 janv. 2015
Pour la date d''observation
Valeur
Changement absolu
Le changement par rapport à la valeur précédente
1 janv. 1962
25.309 mln.
+25.309 mln.
0.0%
1 janv. 1963
26.153 mln.
+843.824 milles
3.33%
1 janv. 1964
26.391 mln.
+238.05 milles
0.91%
1 janv. 1965
27.073 mln.
+681.952 milles
2.58%
1 janv. 1966
26.869 mln.
-203.777 milles
-0.75%
1 janv. 1967
27.565 mln.
+695.432 milles
2.59%
1 janv. 1968
30.209 mln.
+2.644 mln.
9.59%
1 janv. 1969
28.025 mln.
-2.184 mln.
-7.23%
1 janv. 1970
30.835 mln.
+2.81 mln.
10.03%
1 janv. 1971
29.844 mln.
-991.225 milles
-3.21%
1 janv. 1972
30.817 mln.
+973.594 milles
3.26%
1 janv. 1973
30.471 mln.
-346.309 milles
-1.12%
1 janv. 1974
30.342 mln.
-129.369 milles
-0.42%
1 janv. 1975
32.464 mln.
+2.123 mln.
7.0%
1 janv. 1976
33.713 mln.
+1.248 mln.
3.84%
1 janv. 1977
35.68 mln.
+1.968 mln.
5.84%
1 janv. 1978
34.95 mln.
-729.938 milles
-2.05%
1 janv. 1979
35.737 mln.
+786.625 milles
2.25%
1 janv. 1980
34.864 mln.
-872.603 milles
-2.44%
1 janv. 1981
36.149 mln.
+1.285 mln.
3.68%
1 janv. 1982
37.901 mln.
+1.752 mln.
4.85%
1 janv. 1983
35.344 mln.
-2.556 mln.
-6.75%
1 janv. 1984
36.538 mln.
+1.194 mln.
3.38%
1 janv. 1985
34.762 mln.
-1.776 mln.
-4.86%
1 janv. 1986
40.046 mln.
+5.284 mln.
15.2%
1 janv. 1987
40.658 mln.
+611.22 milles
1.53%
1 janv. 1988
38.664 mln.
-1.993 mln.
-4.9%
1 janv. 1989
45.901 mln.
+7.236 mln.
18.72%
1 janv. 1990
43.515 mln.
-2.386 mln.
-5.2%
1 janv. 1991
40.383 mln.
-3.131 mln.
-7.2%
1 janv. 1992
45.541 mln.
+5.157 mln.
12.77%
1 janv. 1993
42.714 mln.
-2.827 mln.
-6.21%
1 janv. 1994
46.17 mln.
+3.456 mln.
8.09%
1 janv. 1995
46.396 mln.
+226.206 milles
0.49%
1 janv. 1996
48.786 mln.
+2.39 mln.
5.15%
1 janv. 1997
55.056 mln.
+6.27 mln.
12.85%
1 janv. 1998
51.212 mln.
-3.844 mln.
-6.98%
1 janv. 1999
55.188 mln.
+3.976 mln.
7.76%
1 janv. 2000
54.574 mln.
-614.183 milles
-1.11%
1 janv. 2001
50.766 mln.
-3.808 mln.
-6.98%
1 janv. 2002
57.52 mln.
+6.754 mln.
13.3%
1 janv. 2003
58.718 mln.
+1.197 mln.
2.08%
1 janv. 2004
65.433 mln.
+6.716 mln.
11.44%
1 janv. 2005
61.281 mln.
-4.153 mln.
-6.35%
1 janv. 2006
71.954 mln.
+10.674 mln.
17.42%
1 janv. 2007
74.787 mln.
+2.833 mln.
3.94%
1 janv. 2008
76.867 mln.
+2.08 mln.
2.78%
1 janv. 2009
82.073 mln.
+5.206 mln.
6.77%
1 janv. 2010
88.899 mln.
+6.826 mln.
8.32%
1 janv. 2011
98.936 mln.
+10.037 mln.
11.29%
1 janv. 2012
94.806 mln.
-4.13 mln.
-4.17%
1 janv. 2013
101.117 mln.
+6.312 mln.
6.66%
1 janv. 2014
104.543 mln.
+3.426 mln.
3.39%
1 janv. 2015
112.953 mln.
+8.41 mln.
8.04%
Classement des pays selon les statistiques actuelles par années


Commentaires: