29
/fr/
fr
AIzaSyAYiBZKx7MnpbEhh9jyipgxe19OcubqV5w
April 1, 2024
228180
Romania
ROU
true
2
1
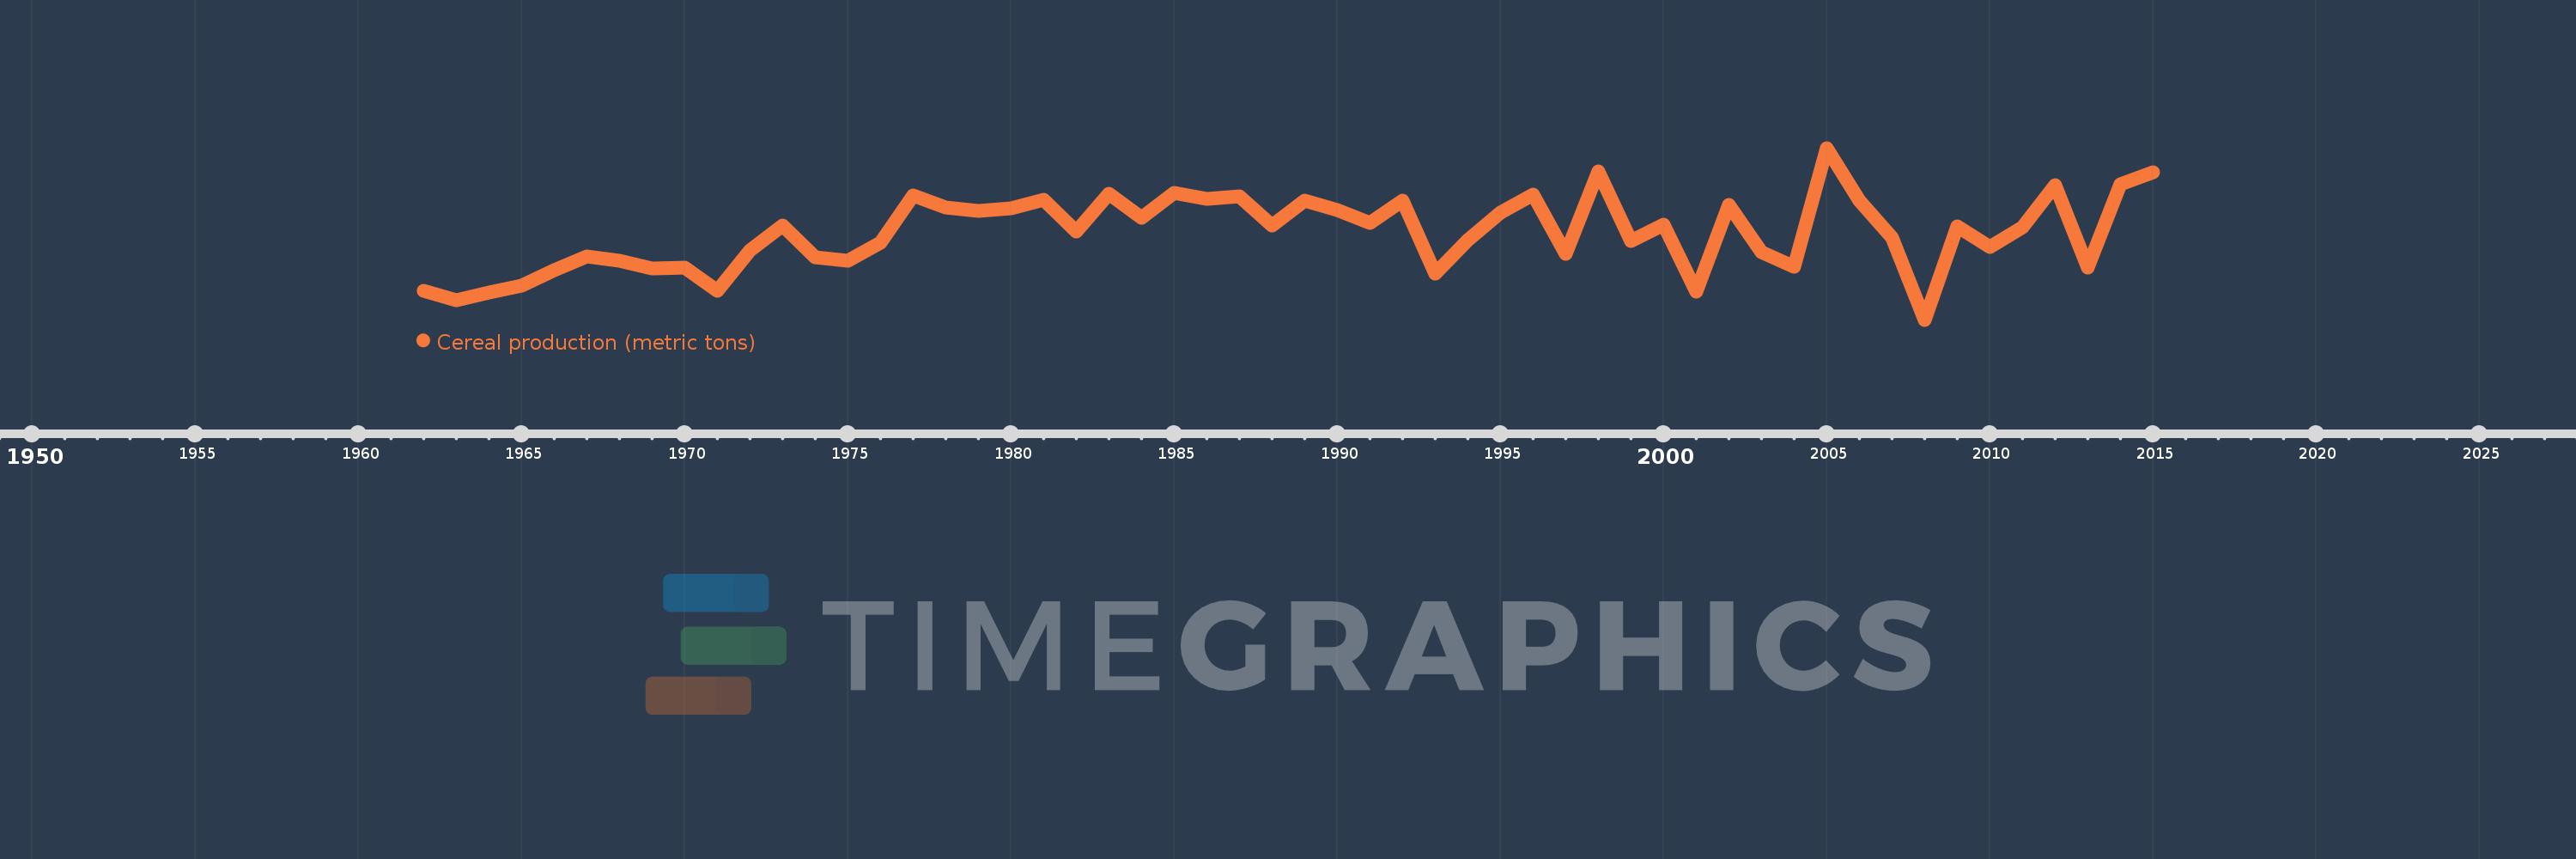
Cereal production (metric tons)
2015,2014,2013,2012,2011,2010,2009,2008,2007,2006,2005,2004,2003,2002,2001,2000,1999,1998,1997,1996,1995,1994,1993,1992,1991,1990,1989,1988,1987,1986,1985,1984,1983,1982,1981,1980,1979,1978,1977,1976,1975,1974,1973,1972,1971,1970,1969,1968,1967,1966,1965,1964,1963,1962
Cette statistique dans les autres pays:
AfghanistanAlbaniaAlgeriaAngolaAntigua and BarbudaArab WorldArgentinaArmeniaAustraliaAustriaAzerbaijanBahamas, TheBangladeshBarbadosBelarusBelgiumBelizeBeninBhutanBoliviaBosnia and HerzegovinaBotswanaBrazilBrunei DarussalamBulgariaBurkina FasoBurundiCabo VerdeCambodiaCameroonCanadaCaribbean small statesCentral African RepublicCentral Europe and the BalticsChadChileChinaColombiaComorosCongo, Dem. Rep.Congo, Rep.Costa RicaCote d'IvoireCroatiaCubaCyprusCzech RepublicDenmarkDjiboutiDominicaDominican RepublicEarly-demographic dividendEast Asia & PacificEast Asia & Pacific (excluding high income)East Asia & Pacific (IDA & IBRD countries)EcuadorEgypt, Arab Rep.El SalvadorEritreaEstoniaEthiopiaEuro areaEurope & Central AsiaEurope & Central Asia (excluding high income)Europe & Central Asia (IDA & IBRD countries)European UnionFijiFinlandFragile and conflict affected situationsFranceGabonGambia, TheGeorgiaGermanyGhanaGreeceGrenadaGuamGuatemalaGuineaGuinea-BissauGuyanaHaitiHeavily indebted poor countries (HIPC)High incomeHondurasHong Kong SAR, ChinaHungaryIBRD onlyIDA & IBRD totalIDA blendIDA onlyIDA totalIndiaIndonesiaIran, Islamic Rep.IraqIrelandIsraelItalyJamaicaJapanJordanKazakhstanKenyaKorea, Dem. People’s Rep.Korea, Rep.KuwaitKyrgyz RepublicLao PDRLate-demographic dividendLatin America & Caribbean Latin America & Caribbean (excluding high income)Latin America & the Caribbean (IDA & IBRD countries)LatviaLeast developed countries: UN classificationLebanonLesothoLiberiaLibyaLithuaniaLow & middle incomeLow incomeLower middle incomeLuxembourgMacedonia, FYRMadagascarMalawiMalaysiaMaldivesMaliMaltaMauritaniaMauritiusMexicoMicronesia, Fed. Sts.Middle East & North AfricaMiddle East & North Africa (excluding high income)Middle East & North Africa (IDA & IBRD countries)Middle incomeMoldovaMongoliaMontenegroMoroccoMozambiqueMyanmarNamibiaNepalNetherlandsNew CaledoniaNew ZealandNicaraguaNigerNigeriaNorth AmericaNorwayOECD membersOmanOther small statesPacific island small statesPakistanPanamaPapua New GuineaParaguayPeruPhilippinesPolandPortugalPost-demographic dividendPre-demographic dividendPuerto RicoQatarRomaniaRussian FederationRwandaSao Tome and PrincipeSaudi ArabiaSenegalSerbiaSierra LeoneSlovak RepublicSloveniaSmall statesSolomon IslandsSomaliaSouth AfricaSouth AsiaSouth Asia (IDA & IBRD)South SudanSpainSri LankaSt. LuciaSt. Vincent and the GrenadinesSub-Saharan Africa Sub-Saharan Africa (excluding high income)Sub-Saharan Africa (IDA & IBRD countries)SudanSurinameSwazilandSwedenSwitzerlandSyrian Arab RepublicTajikistanTanzaniaThailandTimor-LesteTogoTrinidad and TobagoTunisiaTurkeyTurkmenistanUgandaUkraineUnited Arab EmiratesUnited KingdomUnited StatesUpper middle incomeUruguayUzbekistanVanuatuVenezuela, RBVietnamWest Bank and GazaWorldYemen, Rep.ZambiaZimbabwe La ligne de temps
Cette échelle de temps montre un graphique de 1962 année à 2015 année Romania. Les données jusqu'à 1961 année ne sont pas présentés. Quantité d'observations actuelles selon dates: 54.
Source (désignation):
Les indicateurs du développement mondiale
Source (organisation):
Food and Agriculture Organization, electronic files and web site.
Catégories:
Agriculture & Rural Development
Dernière mise à jour
23 avr. 2017
Les indicateurs de changement de valeurs selon les années
Minimum:
7.816 mln.
1 janv. 2008
Maximum:
24.402 mln.
1 janv. 2005
Pour la date d''observation
Valeur
Changement absolu
Le changement par rapport à la valeur précédente
1 janv. 1962
10.612 mln.
+10.612 mln.
0.0%
1 janv. 1963
9.677 mln.
-934.9 milles
-8.81%
1 janv. 1964
10.436 mln.
+758.6 milles
7.84%
1 janv. 1965
11.107 mln.
+670.7 milles
6.43%
1 janv. 1966
12.601 mln.
+1.495 mln.
13.46%
1 janv. 1967
13.899 mln.
+1.298 mln.
10.3%
1 janv. 1968
13.512 mln.
-387.633 milles
-2.79%
1 janv. 1969
12.77 mln.
-741.318 milles
-5.49%
1 janv. 1970
12.824 mln.
+53.191 milles
0.42%
1 janv. 1971
10.632 mln.
-2.192 mln.
-17.09%
1 janv. 1972
14.53 mln.
+3.898 mln.
36.66%
1 janv. 1973
16.913 mln.
+2.383 mln.
16.4%
1 janv. 1974
13.81 mln.
-3.102 mln.
-18.34%
1 janv. 1975
13.55 mln.
-260.1 milles
-1.88%
1 janv. 1976
15.266 mln.
+1.716 mln.
12.66%
1 janv. 1977
19.791 mln.
+4.525 mln.
29.64%
1 janv. 1978
18.614 mln.
-1.177 mln.
-5.95%
1 janv. 1979
18.313 mln.
-300.577 milles
-1.61%
1 janv. 1980
18.587 mln.
+273.508 milles
1.49%
1 janv. 1981
19.367 mln.
+779.71 milles
4.19%
1 janv. 1982
16.373 mln.
-2.994 mln.
-15.46%
1 janv. 1983
19.954 mln.
+3.581 mln.
21.87%
1 janv. 1984
17.666 mln.
-2.289 mln.
-11.47%
1 janv. 1985
20.045 mln.
+2.379 mln.
13.47%
1 janv. 1986
19.503 mln.
-541.9 milles
-2.7%
1 janv. 1987
19.725 mln.
+222.4 milles
1.14%
1 janv. 1988
16.89 mln.
-2.836 mln.
-14.38%
1 janv. 1989
19.286 mln.
+2.397 mln.
14.19%
1 janv. 1990
18.379 mln.
-907.37 milles
-4.7%
1 janv. 1991
17.174 mln.
-1.205 mln.
-6.56%
1 janv. 1992
19.307 mln.
+2.133 mln.
12.42%
1 janv. 1993
12.288 mln.
-7.018 mln.
-36.35%
1 janv. 1994
15.493 mln.
+3.205 mln.
26.08%
1 janv. 1995
18.184 mln.
+2.691 mln.
17.37%
1 janv. 1996
19.883 mln.
+1.699 mln.
9.34%
1 janv. 1997
14.2 mln.
-5.683 mln.
-28.58%
1 janv. 1998
22.107 mln.
+7.907 mln.
55.69%
1 janv. 1999
15.453 mln.
-6.654 mln.
-30.1%
1 janv. 2000
17.037 mln.
+1.584 mln.
10.25%
1 janv. 2001
10.499 mln.
-6.538 mln.
-38.38%
1 janv. 2002
18.9 mln.
+8.401 mln.
80.01%
1 janv. 2003
14.357 mln.
-4.543 mln.
-24.03%
1 janv. 2004
12.966 mln.
-1.391 mln.
-9.69%
1 janv. 2005
24.402 mln.
+11.435 mln.
88.19%
1 janv. 2006
19.35 mln.
-5.051 mln.
-20.7%
1 janv. 2007
15.76 mln.
-3.591 mln.
-18.56%
1 janv. 2008
7.816 mln.
-7.944 mln.
-50.41%
1 janv. 2009
16.829 mln.
+9.013 mln.
115.32%
1 janv. 2010
14.874 mln.
-1.955 mln.
-11.62%
1 janv. 2011
16.717 mln.
+1.843 mln.
12.39%
1 janv. 2012
20.848 mln.
+4.132 mln.
24.72%
1 janv. 2013
12.831 mln.
-8.017 mln.
-38.45%
1 janv. 2014
20.897 mln.
+8.066 mln.
62.86%
1 janv. 2015
22.071 mln.
+1.174 mln.
5.62%
Classement des pays selon les statistiques actuelles par années


Commentaires: