29
/fr/
fr
AIzaSyAYiBZKx7MnpbEhh9jyipgxe19OcubqV5w
April 1, 2024
55468
Pre-demographic dividend
PRE
false
2
1
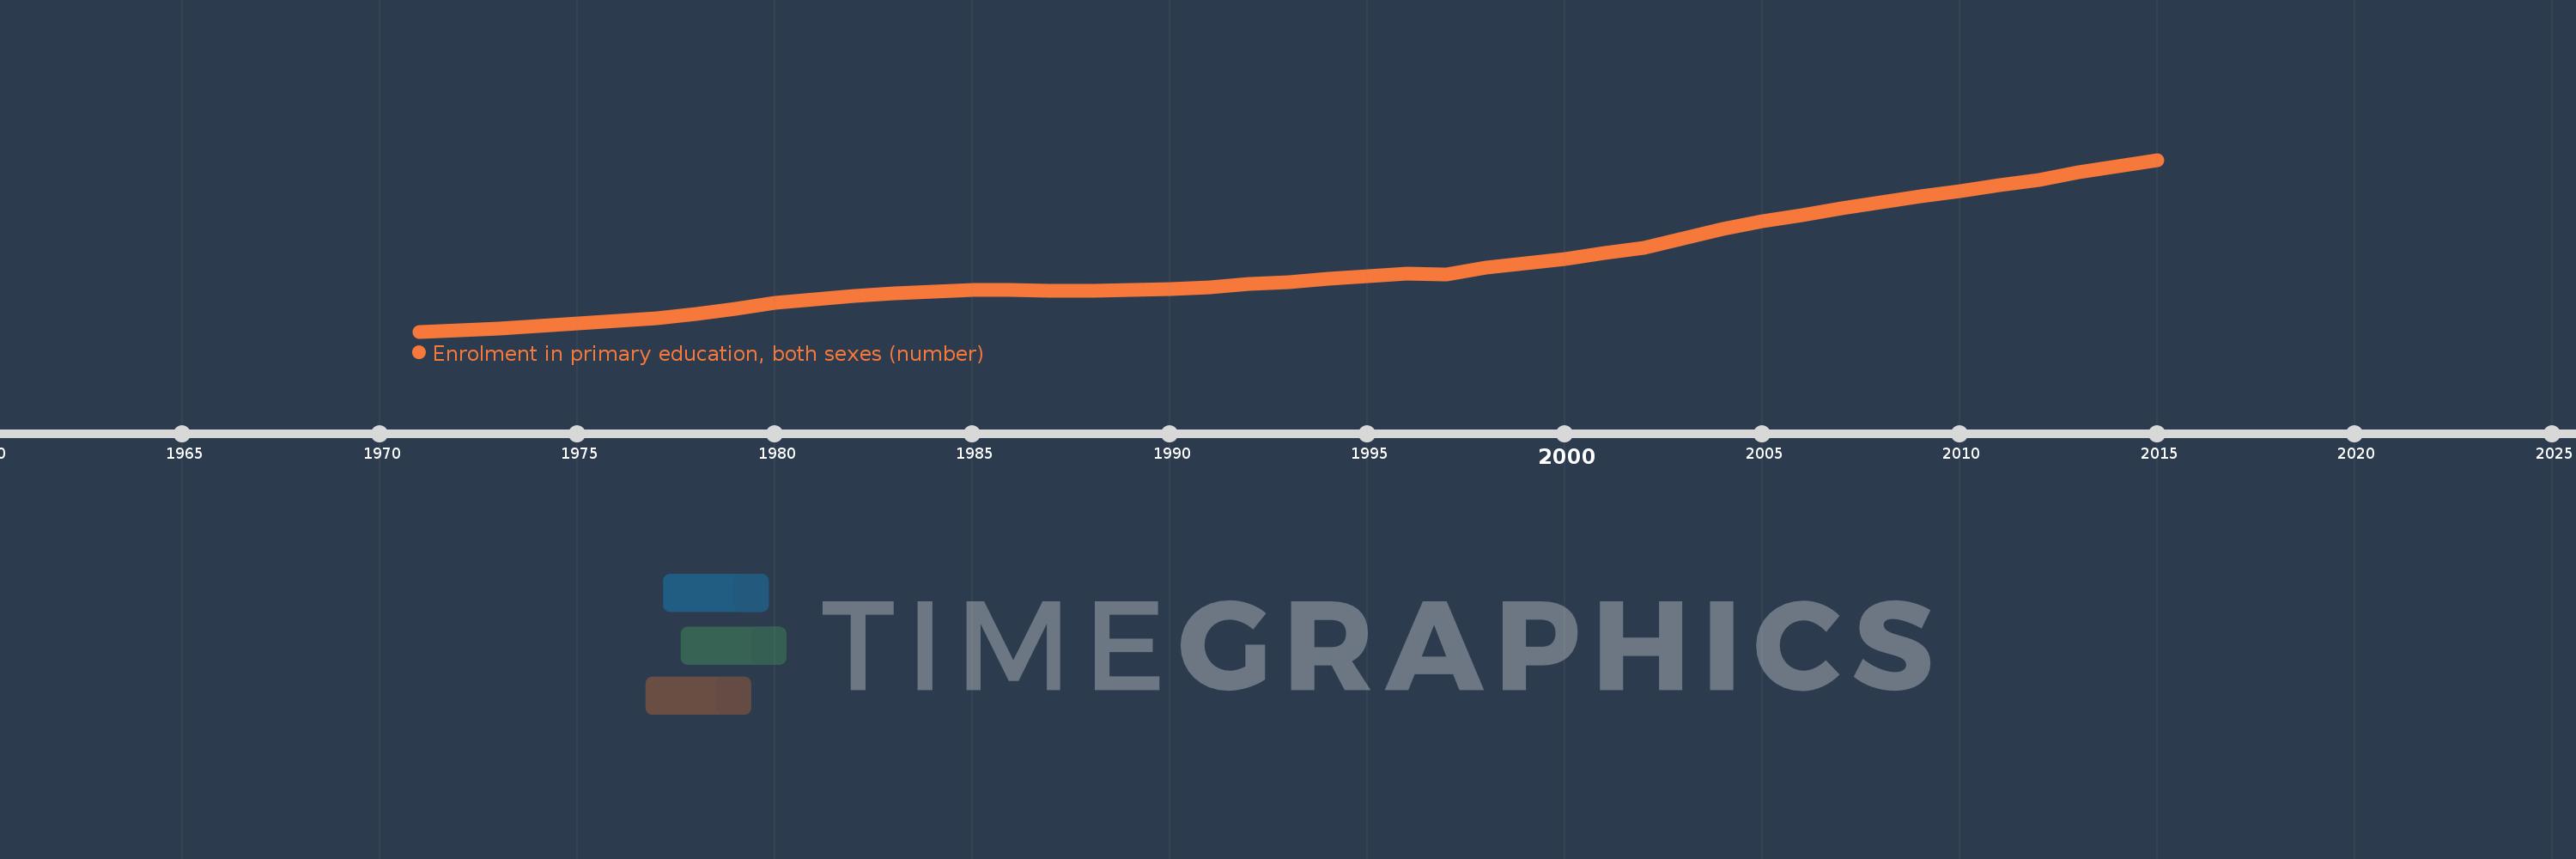
Enrolment in primary education, both sexes (number)
2015,2014,2013,2012,2011,2010,2009,2008,2007,2006,2005,2004,2003,2002,2001,2000,1999,1998,1997,1996,1995,1994,1993,1992,1991,1990,1989,1988,1987,1986,1985,1984,1983,1982,1981,1980,1979,1978,1977,1976,1975,1974,1973,1972,1971
Cette statistique dans les autres pays:
AfghanistanAlbaniaAlgeriaAmerican SamoaAndorraAngolaAntigua and BarbudaArab WorldArgentinaArmeniaArubaAustraliaAustriaAzerbaijanBahamas, TheBahrainBangladeshBarbadosBelarusBelgiumBelizeBeninBermudaBhutanBoliviaBosnia and HerzegovinaBotswanaBrazilBritish Virgin IslandsBrunei DarussalamBulgariaBurkina FasoBurundiCabo VerdeCambodiaCameroonCanadaCaribbean small statesCayman IslandsCentral African RepublicCentral Europe and the BalticsChadChileChinaColombiaComorosCongo, Dem. Rep.Congo, Rep.Costa RicaCote d'IvoireCroatiaCubaCuracaoCyprusCzech RepublicDenmarkDjiboutiDominicaDominican RepublicEarly-demographic dividendEast Asia & PacificEast Asia & Pacific (excluding high income)East Asia & Pacific (IDA & IBRD countries)EcuadorEgypt, Arab Rep.El SalvadorEquatorial GuineaEritreaEstoniaEthiopiaEuro areaEurope & Central AsiaEurope & Central Asia (excluding high income)Europe & Central Asia (IDA & IBRD countries)European UnionFaroe IslandsFijiFinlandFragile and conflict affected situationsFranceFrench PolynesiaGabonGambia, TheGeorgiaGermanyGhanaGibraltarGreeceGrenadaGuamGuatemalaGuineaGuinea-BissauGuyanaHaitiHeavily indebted poor countries (HIPC)High incomeHondurasHong Kong SAR, ChinaHungaryIBRD onlyIcelandIDA & IBRD totalIDA blendIDA onlyIDA totalIndiaIndonesiaIran, Islamic Rep.IraqIrelandIsraelItalyJamaicaJapanJordanKazakhstanKenyaKiribatiKorea, Dem. People’s Rep.Korea, Rep.KuwaitKyrgyz RepublicLao PDRLate-demographic dividendLatin America & Caribbean Latin America & Caribbean (excluding high income)Latin America & the Caribbean (IDA & IBRD countries)LatviaLeast developed countries: UN classificationLebanonLesothoLiberiaLibyaLiechtensteinLithuaniaLow & middle incomeLow incomeLower middle incomeLuxembourgMacao SAR, ChinaMacedonia, FYRMadagascarMalawiMalaysiaMaldivesMaliMaltaMarshall IslandsMauritaniaMauritiusMexicoMicronesia, Fed. Sts.Middle East & North AfricaMiddle East & North Africa (excluding high income)Middle East & North Africa (IDA & IBRD countries)Middle incomeMoldovaMonacoMongoliaMontenegroMoroccoMozambiqueMyanmarNamibiaNauruNepalNetherlandsNew CaledoniaNew ZealandNicaraguaNigerNigeriaNorth AmericaNorwayOECD membersOmanOther small statesPacific island small statesPakistanPalauPanamaPapua New GuineaParaguayPeruPhilippinesPolandPortugalPost-demographic dividendPre-demographic dividendPuerto RicoQatarRomaniaRussian FederationRwandaSamoaSan MarinoSao Tome and PrincipeSaudi ArabiaSenegalSerbiaSeychellesSierra LeoneSingaporeSint Maarten (Dutch part)Slovak RepublicSloveniaSmall statesSolomon IslandsSomaliaSouth AfricaSouth AsiaSouth Asia (IDA & IBRD)South SudanSpainSri LankaSt. Kitts and NevisSt. LuciaSt. Vincent and the GrenadinesSub-Saharan Africa Sub-Saharan Africa (excluding high income)Sub-Saharan Africa (IDA & IBRD countries)SudanSurinameSwazilandSwedenSwitzerlandSyrian Arab RepublicTajikistanTanzaniaThailandTimor-LesteTogoTongaTrinidad and TobagoTunisiaTurkeyTurkmenistanTurks and Caicos IslandsTuvaluUgandaUkraineUnited Arab EmiratesUnited KingdomUnited StatesUpper middle incomeUruguayUzbekistanVanuatuVenezuela, RBVietnamVirgin Islands (U.S.)West Bank and GazaWorldYemen, Rep.ZambiaZimbabwe La ligne de temps
Cette échelle de temps montre un graphique de 1971 année à 2015 année Pre-demographic dividend. Les données jusqu'à 1970 année ne sont pas présentés. Quantité d'observations actuelles selon dates: 45.
Source (désignation):
Les indicateurs du développement mondiale
Source (organisation):
UNESCO Institute for Statistics
Catégories:
Education
Dernière mise à jour
23 avr. 2017
Les indicateurs de changement de valeurs selon les années
Minimum:
21.325 mln.
1 janv. 1971
Maximum:
136.352 mln.
1 janv. 2015
Pour la date d''observation
Valeur
Changement absolu
Le changement par rapport à la valeur précédente
1 janv. 1971
21.325 mln.
+21.325 mln.
0.0%
1 janv. 1972
22.353 mln.
+1.028 mln.
4.82%
1 janv. 1973
23.619 mln.
+1.266 mln.
5.66%
1 janv. 1974
24.889 mln.
+1.27 mln.
5.38%
1 janv. 1975
26.784 mln.
+1.895 mln.
7.61%
1 janv. 1976
28.273 mln.
+1.489 mln.
5.56%
1 janv. 1977
30.025 mln.
+1.752 mln.
6.2%
1 janv. 1978
33.063 mln.
+3.038 mln.
10.12%
1 janv. 1979
36.73 mln.
+3.667 mln.
11.09%
1 janv. 1980
40.782 mln.
+4.052 mln.
11.03%
1 janv. 1981
43.167 mln.
+2.385 mln.
5.85%
1 janv. 1982
45.307 mln.
+2.14 mln.
4.96%
1 janv. 1983
47.114 mln.
+1.807 mln.
3.99%
1 janv. 1984
48.291 mln.
+1.177 mln.
2.5%
1 janv. 1985
49.225 mln.
+934.464 milles
1.94%
1 janv. 1986
48.993 mln.
-231.796 milles
-0.47%
1 janv. 1987
48.522 mln.
-471.628 milles
-0.96%
1 janv. 1988
48.788 mln.
+266.172 milles
0.55%
1 janv. 1989
49.493 mln.
+705.188 milles
1.45%
1 janv. 1990
49.864 mln.
+371.248 milles
0.75%
1 janv. 1991
51.063 mln.
+1.199 mln.
2.41%
1 janv. 1992
53.26 mln.
+2.197 mln.
4.3%
1 janv. 1993
54.341 mln.
+1.08 mln.
2.03%
1 janv. 1994
56.886 mln.
+2.545 mln.
4.68%
1 janv. 1995
58.442 mln.
+1.556 mln.
2.74%
1 janv. 1996
60.362 mln.
+1.92 mln.
3.29%
1 janv. 1997
59.376 mln.
-985.456 milles
-1.63%
1 janv. 1998
64.029 mln.
+4.652 mln.
7.84%
1 janv. 1999
67.262 mln.
+3.234 mln.
5.05%
1 janv. 2000
69.709 mln.
+2.447 mln.
3.64%
1 janv. 2001
73.69 mln.
+3.981 mln.
5.71%
1 janv. 2002
77.451 mln.
+3.761 mln.
5.1%
1 janv. 2003
83.711 mln.
+6.26 mln.
8.08%
1 janv. 2004
90.21 mln.
+6.499 mln.
7.76%
1 janv. 2005
95.274 mln.
+5.064 mln.
5.61%
1 janv. 2006
99.117 mln.
+3.843 mln.
4.03%
1 janv. 2007
103.633 mln.
+4.516 mln.
4.56%
1 janv. 2008
107.632 mln.
+3.999 mln.
3.86%
1 janv. 2009
111.695 mln.
+4.064 mln.
3.78%
1 janv. 2010
115.593 mln.
+3.897 mln.
3.49%
1 janv. 2011
119.332 mln.
+3.739 mln.
3.23%
1 janv. 2012
123.094 mln.
+3.762 mln.
3.15%
1 janv. 2013
127.936 mln.
+4.842 mln.
3.93%
1 janv. 2014
131.792 mln.
+3.855 mln.
3.01%
1 janv. 2015
136.352 mln.
+4.56 mln.
3.46%
Classement des pays selon les statistiques actuelles par années


Commentaires: