29
/fr/
fr
AIzaSyAYiBZKx7MnpbEhh9jyipgxe19OcubqV5w
April 1, 2024
36516
IBRD only
IBD
false
2
1
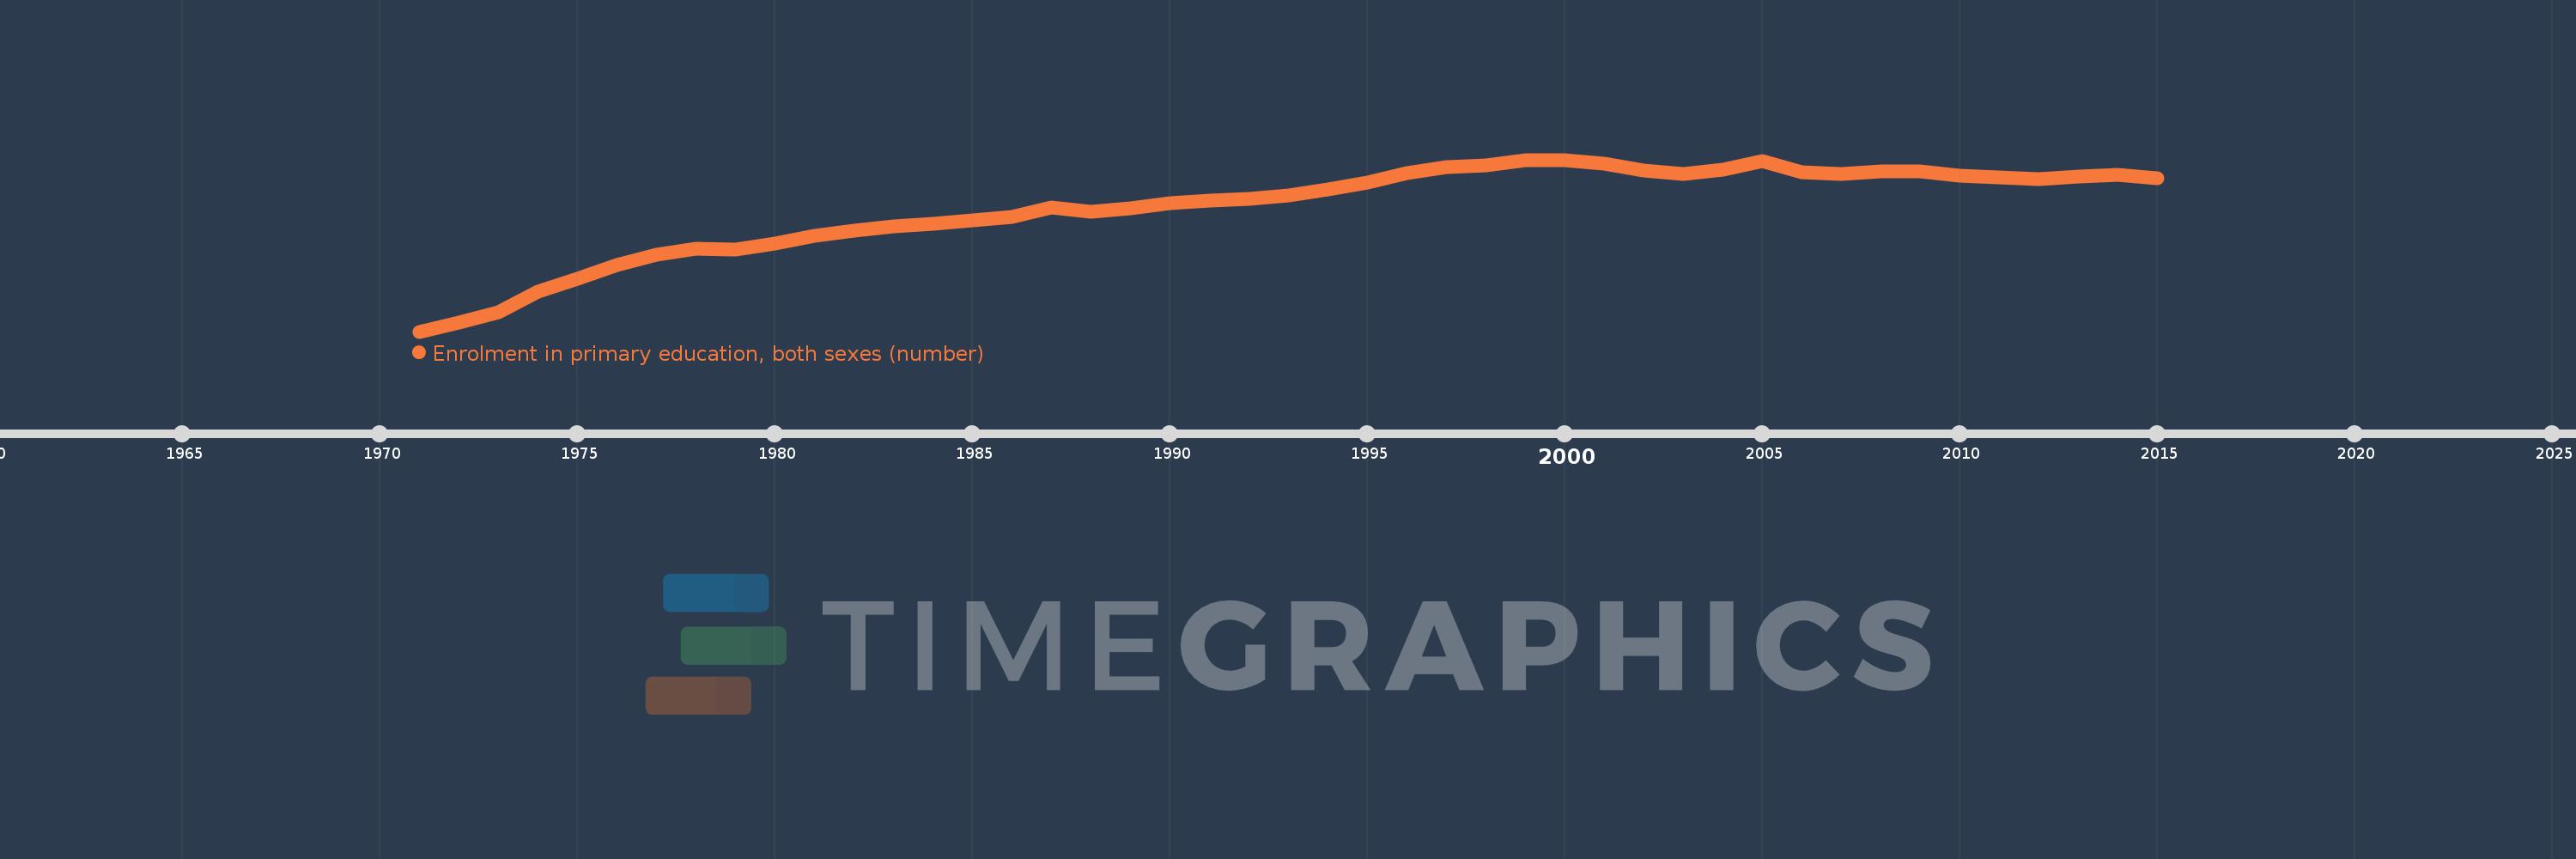
Enrolment in primary education, both sexes (number)
2015,2014,2013,2012,2011,2010,2009,2008,2007,2006,2005,2004,2003,2002,2001,2000,1999,1998,1997,1996,1995,1994,1993,1992,1991,1990,1989,1988,1987,1986,1985,1984,1983,1982,1981,1980,1979,1978,1977,1976,1975,1974,1973,1972,1971
Cette statistique dans les autres pays:
AfghanistanAlbaniaAlgeriaAmerican SamoaAndorraAngolaAntigua and BarbudaArab WorldArgentinaArmeniaArubaAustraliaAustriaAzerbaijanBahamas, TheBahrainBangladeshBarbadosBelarusBelgiumBelizeBeninBermudaBhutanBoliviaBosnia and HerzegovinaBotswanaBrazilBritish Virgin IslandsBrunei DarussalamBulgariaBurkina FasoBurundiCabo VerdeCambodiaCameroonCanadaCaribbean small statesCayman IslandsCentral African RepublicCentral Europe and the BalticsChadChileChinaColombiaComorosCongo, Dem. Rep.Congo, Rep.Costa RicaCote d'IvoireCroatiaCubaCuracaoCyprusCzech RepublicDenmarkDjiboutiDominicaDominican RepublicEarly-demographic dividendEast Asia & PacificEast Asia & Pacific (excluding high income)East Asia & Pacific (IDA & IBRD countries)EcuadorEgypt, Arab Rep.El SalvadorEquatorial GuineaEritreaEstoniaEthiopiaEuro areaEurope & Central AsiaEurope & Central Asia (excluding high income)Europe & Central Asia (IDA & IBRD countries)European UnionFaroe IslandsFijiFinlandFragile and conflict affected situationsFranceFrench PolynesiaGabonGambia, TheGeorgiaGermanyGhanaGibraltarGreeceGrenadaGuamGuatemalaGuineaGuinea-BissauGuyanaHaitiHeavily indebted poor countries (HIPC)High incomeHondurasHong Kong SAR, ChinaHungaryIBRD onlyIcelandIDA & IBRD totalIDA blendIDA onlyIDA totalIndiaIndonesiaIran, Islamic Rep.IraqIrelandIsraelItalyJamaicaJapanJordanKazakhstanKenyaKiribatiKorea, Dem. People’s Rep.Korea, Rep.KuwaitKyrgyz RepublicLao PDRLate-demographic dividendLatin America & Caribbean Latin America & Caribbean (excluding high income)Latin America & the Caribbean (IDA & IBRD countries)LatviaLeast developed countries: UN classificationLebanonLesothoLiberiaLibyaLiechtensteinLithuaniaLow & middle incomeLow incomeLower middle incomeLuxembourgMacao SAR, ChinaMacedonia, FYRMadagascarMalawiMalaysiaMaldivesMaliMaltaMarshall IslandsMauritaniaMauritiusMexicoMicronesia, Fed. Sts.Middle East & North AfricaMiddle East & North Africa (excluding high income)Middle East & North Africa (IDA & IBRD countries)Middle incomeMoldovaMonacoMongoliaMontenegroMoroccoMozambiqueMyanmarNamibiaNauruNepalNetherlandsNew CaledoniaNew ZealandNicaraguaNigerNigeriaNorth AmericaNorwayOECD membersOmanOther small statesPacific island small statesPakistanPalauPanamaPapua New GuineaParaguayPeruPhilippinesPolandPortugalPost-demographic dividendPre-demographic dividendPuerto RicoQatarRomaniaRussian FederationRwandaSamoaSan MarinoSao Tome and PrincipeSaudi ArabiaSenegalSerbiaSeychellesSierra LeoneSingaporeSint Maarten (Dutch part)Slovak RepublicSloveniaSmall statesSolomon IslandsSomaliaSouth AfricaSouth AsiaSouth Asia (IDA & IBRD)South SudanSpainSri LankaSt. Kitts and NevisSt. LuciaSt. Vincent and the GrenadinesSub-Saharan Africa Sub-Saharan Africa (excluding high income)Sub-Saharan Africa (IDA & IBRD countries)SudanSurinameSwazilandSwedenSwitzerlandSyrian Arab RepublicTajikistanTanzaniaThailandTimor-LesteTogoTongaTrinidad and TobagoTunisiaTurkeyTurkmenistanTurks and Caicos IslandsTuvaluUgandaUkraineUnited Arab EmiratesUnited KingdomUnited StatesUpper middle incomeUruguayUzbekistanVanuatuVenezuela, RBVietnamVirgin Islands (U.S.)West Bank and GazaWorldYemen, Rep.ZambiaZimbabwe La ligne de temps
Cette échelle de temps montre un graphique de 1971 année à 2015 année IBRD only. Les données jusqu'à 1970 année ne sont pas présentés. Quantité d'observations actuelles selon dates: 45.
Source (désignation):
Les indicateurs du développement mondiale
Source (organisation):
UNESCO Institute for Statistics
Catégories:
Education
Dernière mise à jour
23 avr. 2017
Les indicateurs de changement de valeurs selon les années
Minimum:
269.999 mln.
1 janv. 1971
Maximum:
436.915 mln.
1 janv. 1999
Pour la date d''observation
Valeur
Changement absolu
Le changement par rapport à la valeur précédente
1 janv. 1971
269.999 mln.
+269.999 mln.
0.0%
1 janv. 1972
278.609 mln.
+8.61 mln.
3.19%
1 janv. 1973
289.083 mln.
+10.474 mln.
3.76%
1 janv. 1974
308.49 mln.
+19.406 mln.
6.71%
1 janv. 1975
321.264 mln.
+12.774 mln.
4.14%
1 janv. 1976
334.731 mln.
+13.467 mln.
4.19%
1 janv. 1977
344.33 mln.
+9.599 mln.
2.87%
1 janv. 1978
350.643 mln.
+6.313 mln.
1.83%
1 janv. 1979
349.741 mln.
-902.176 milles
-0.26%
1 janv. 1980
355.658 mln.
+5.917 mln.
1.69%
1 janv. 1981
363.011 mln.
+7.353 mln.
2.07%
1 janv. 1982
368.458 mln.
+5.447 mln.
1.5%
1 janv. 1983
372.086 mln.
+3.628 mln.
0.98%
1 janv. 1984
374.56 mln.
+2.473 mln.
0.66%
1 janv. 1985
378.308 mln.
+3.748 mln.
1.0%
1 janv. 1986
381.729 mln.
+3.422 mln.
0.9%
1 janv. 1987
390.283 mln.
+8.553 mln.
2.24%
1 janv. 1988
386.171 mln.
-4.112 mln.
-1.05%
1 janv. 1989
389.822 mln.
+3.651 mln.
0.95%
1 janv. 1990
394.955 mln.
+5.133 mln.
1.32%
1 janv. 1991
397.647 mln.
+2.691 mln.
0.68%
1 janv. 1992
399.339 mln.
+1.693 mln.
0.43%
1 janv. 1993
402.129 mln.
+2.79 mln.
0.7%
1 janv. 1994
407.988 mln.
+5.858 mln.
1.46%
1 janv. 1995
415.193 mln.
+7.206 mln.
1.77%
1 janv. 1996
424.219 mln.
+9.026 mln.
2.17%
1 janv. 1997
429.915 mln.
+5.696 mln.
1.34%
1 janv. 1998
431.79 mln.
+1.875 mln.
0.44%
1 janv. 1999
436.915 mln.
+5.125 mln.
1.19%
1 janv. 2000
436.228 mln.
-686.944 milles
-0.16%
1 janv. 2001
433.421 mln.
-2.806 mln.
-0.64%
1 janv. 2002
426.296 mln.
-7.125 mln.
-1.64%
1 janv. 2003
423.231 mln.
-3.065 mln.
-0.72%
1 janv. 2004
427.529 mln.
+4.299 mln.
1.02%
1 janv. 2005
436.034 mln.
+8.505 mln.
1.99%
1 janv. 2006
424.984 mln.
-11.05 mln.
-2.53%
1 janv. 2007
422.759 mln.
-2.225 mln.
-0.52%
1 janv. 2008
426.044 mln.
+3.284 mln.
0.78%
1 janv. 2009
425.49 mln.
-553.28 milles
-0.13%
1 janv. 2010
421.87 mln.
-3.62 mln.
-0.85%
1 janv. 2011
419.413 mln.
-2.457 mln.
-0.58%
1 janv. 2012
417.907 mln.
-1.506 mln.
-0.36%
1 janv. 2013
420.603 mln.
+2.696 mln.
0.65%
1 janv. 2014
422.673 mln.
+2.07 mln.
0.49%
1 janv. 2015
419.336 mln.
-3.337 mln.
-0.79%
Classement des pays selon les statistiques actuelles par années


Commentaires: