29
/fr/
fr
AIzaSyAYiBZKx7MnpbEhh9jyipgxe19OcubqV5w
April 1, 2024
40651
Late-demographic dividend
LTE
false
2
1
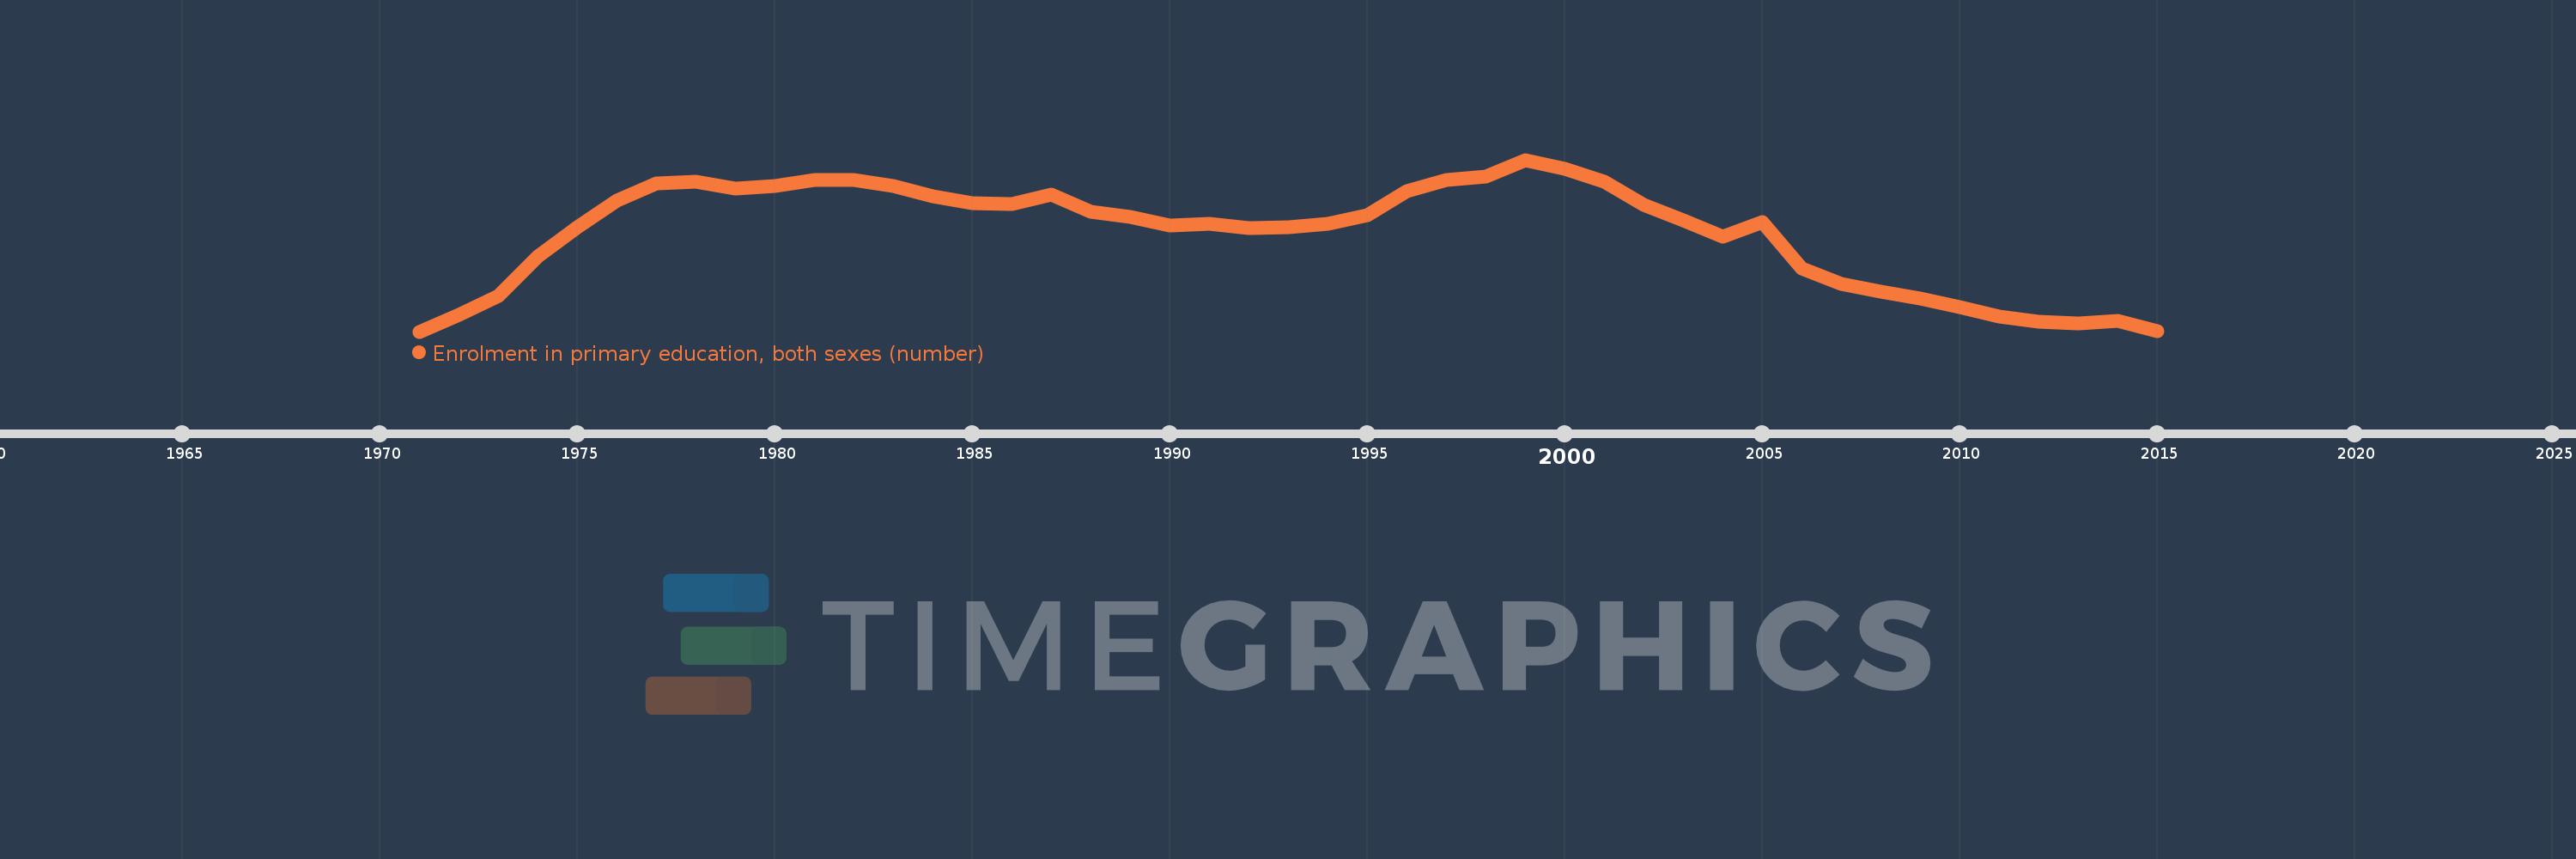
Enrolment in primary education, both sexes (number)
2015,2014,2013,2012,2011,2010,2009,2008,2007,2006,2005,2004,2003,2002,2001,2000,1999,1998,1997,1996,1995,1994,1993,1992,1991,1990,1989,1988,1987,1986,1985,1984,1983,1982,1981,1980,1979,1978,1977,1976,1975,1974,1973,1972,1971
Cette statistique dans les autres pays:
AfghanistanAlbaniaAlgeriaAmerican SamoaAndorraAngolaAntigua and BarbudaArab WorldArgentinaArmeniaArubaAustraliaAustriaAzerbaijanBahamas, TheBahrainBangladeshBarbadosBelarusBelgiumBelizeBeninBermudaBhutanBoliviaBosnia and HerzegovinaBotswanaBrazilBritish Virgin IslandsBrunei DarussalamBulgariaBurkina FasoBurundiCabo VerdeCambodiaCameroonCanadaCaribbean small statesCayman IslandsCentral African RepublicCentral Europe and the BalticsChadChileChinaColombiaComorosCongo, Dem. Rep.Congo, Rep.Costa RicaCote d'IvoireCroatiaCubaCuracaoCyprusCzech RepublicDenmarkDjiboutiDominicaDominican RepublicEarly-demographic dividendEast Asia & PacificEast Asia & Pacific (excluding high income)East Asia & Pacific (IDA & IBRD countries)EcuadorEgypt, Arab Rep.El SalvadorEquatorial GuineaEritreaEstoniaEthiopiaEuro areaEurope & Central AsiaEurope & Central Asia (excluding high income)Europe & Central Asia (IDA & IBRD countries)European UnionFaroe IslandsFijiFinlandFragile and conflict affected situationsFranceFrench PolynesiaGabonGambia, TheGeorgiaGermanyGhanaGibraltarGreeceGrenadaGuamGuatemalaGuineaGuinea-BissauGuyanaHaitiHeavily indebted poor countries (HIPC)High incomeHondurasHong Kong SAR, ChinaHungaryIBRD onlyIcelandIDA & IBRD totalIDA blendIDA onlyIDA totalIndiaIndonesiaIran, Islamic Rep.IraqIrelandIsraelItalyJamaicaJapanJordanKazakhstanKenyaKiribatiKorea, Dem. People’s Rep.Korea, Rep.KuwaitKyrgyz RepublicLao PDRLate-demographic dividendLatin America & Caribbean Latin America & Caribbean (excluding high income)Latin America & the Caribbean (IDA & IBRD countries)LatviaLeast developed countries: UN classificationLebanonLesothoLiberiaLibyaLiechtensteinLithuaniaLow & middle incomeLow incomeLower middle incomeLuxembourgMacao SAR, ChinaMacedonia, FYRMadagascarMalawiMalaysiaMaldivesMaliMaltaMarshall IslandsMauritaniaMauritiusMexicoMicronesia, Fed. Sts.Middle East & North AfricaMiddle East & North Africa (excluding high income)Middle East & North Africa (IDA & IBRD countries)Middle incomeMoldovaMonacoMongoliaMontenegroMoroccoMozambiqueMyanmarNamibiaNauruNepalNetherlandsNew CaledoniaNew ZealandNicaraguaNigerNigeriaNorth AmericaNorwayOECD membersOmanOther small statesPacific island small statesPakistanPalauPanamaPapua New GuineaParaguayPeruPhilippinesPolandPortugalPost-demographic dividendPre-demographic dividendPuerto RicoQatarRomaniaRussian FederationRwandaSamoaSan MarinoSao Tome and PrincipeSaudi ArabiaSenegalSerbiaSeychellesSierra LeoneSingaporeSint Maarten (Dutch part)Slovak RepublicSloveniaSmall statesSolomon IslandsSomaliaSouth AfricaSouth AsiaSouth Asia (IDA & IBRD)South SudanSpainSri LankaSt. Kitts and NevisSt. LuciaSt. Vincent and the GrenadinesSub-Saharan Africa Sub-Saharan Africa (excluding high income)Sub-Saharan Africa (IDA & IBRD countries)SudanSurinameSwazilandSwedenSwitzerlandSyrian Arab RepublicTajikistanTanzaniaThailandTimor-LesteTogoTongaTrinidad and TobagoTunisiaTurkeyTurkmenistanTurks and Caicos IslandsTuvaluUgandaUkraineUnited Arab EmiratesUnited KingdomUnited StatesUpper middle incomeUruguayUzbekistanVanuatuVenezuela, RBVietnamVirgin Islands (U.S.)West Bank and GazaWorldYemen, Rep.ZambiaZimbabwe La ligne de temps
Cette échelle de temps montre un graphique de 1971 année à 2015 année Late-demographic dividend. Les données jusqu'à 1970 année ne sont pas présentés. Quantité d'observations actuelles selon dates: 45.
Source (désignation):
Les indicateurs du développement mondiale
Source (organisation):
UNESCO Institute for Statistics
Catégories:
Education
Dernière mise à jour
23 avr. 2017
Les indicateurs de changement de valeurs selon les années
Minimum:
158.906 mln.
1 janv. 1971
Maximum:
218.389 mln.
1 janv. 1999
Pour la date d''observation
Valeur
Changement absolu
Le changement par rapport à la valeur précédente
1 janv. 1971
158.906 mln.
+158.906 mln.
0.0%
1 janv. 1972
164.637 mln.
+5.731 mln.
3.61%
1 janv. 1973
171.375 mln.
+6.739 mln.
4.09%
1 janv. 1974
184.973 mln.
+13.597 mln.
7.93%
1 janv. 1975
195.132 mln.
+10.159 mln.
5.49%
1 janv. 1976
204.226 mln.
+9.095 mln.
4.66%
1 janv. 1977
210.321 mln.
+6.095 mln.
2.98%
1 janv. 1978
210.818 mln.
+496.944 milles
0.24%
1 janv. 1979
208.535 mln.
-2.283 mln.
-1.08%
1 janv. 1980
209.379 mln.
+844.016 milles
0.4%
1 janv. 1981
211.467 mln.
+2.088 mln.
1.0%
1 janv. 1982
211.467 mln.
+64.0
0.0%
1 janv. 1983
209.428 mln.
-2.039 mln.
-0.96%
1 janv. 1984
205.888 mln.
-3.54 mln.
-1.69%
1 janv. 1985
203.284 mln.
-2.604 mln.
-1.26%
1 janv. 1986
203.041 mln.
-243.168 milles
-0.12%
1 janv. 1987
206.491 mln.
+3.451 mln.
1.7%
1 janv. 1988
200.465 mln.
-6.027 mln.
-2.92%
1 janv. 1989
198.715 mln.
-1.749 mln.
-0.87%
1 janv. 1990
195.504 mln.
-3.211 mln.
-1.62%
1 janv. 1991
196.181 mln.
+676.976 milles
0.35%
1 janv. 1992
194.707 mln.
-1.474 mln.
-0.75%
1 janv. 1993
194.901 mln.
+194.144 milles
0.1%
1 janv. 1994
196.152 mln.
+1.251 mln.
0.64%
1 janv. 1995
199.225 mln.
+3.073 mln.
1.57%
1 janv. 1996
207.679 mln.
+8.455 mln.
4.24%
1 janv. 1997
211.431 mln.
+3.752 mln.
1.81%
1 janv. 1998
212.736 mln.
+1.305 mln.
0.62%
1 janv. 1999
218.389 mln.
+5.653 mln.
2.66%
1 janv. 2000
215.365 mln.
-3.024 mln.
-1.38%
1 janv. 2001
210.904 mln.
-4.461 mln.
-2.07%
1 janv. 2002
202.842 mln.
-8.063 mln.
-3.82%
1 janv. 2003
197.361 mln.
-5.48 mln.
-2.7%
1 janv. 2004
191.825 mln.
-5.536 mln.
-2.8%
1 janv. 2005
196.91 mln.
+5.085 mln.
2.65%
1 janv. 2006
180.912 mln.
-15.998 mln.
-8.12%
1 janv. 2007
175.513 mln.
-5.398 mln.
-2.98%
1 janv. 2008
172.77 mln.
-2.743 mln.
-1.56%
1 janv. 2009
170.444 mln.
-2.326 mln.
-1.35%
1 janv. 2010
167.282 mln.
-3.162 mln.
-1.86%
1 janv. 2011
163.981 mln.
-3.301 mln.
-1.97%
1 janv. 2012
162.306 mln.
-1.675 mln.
-1.02%
1 janv. 2013
161.867 mln.
-438.56 milles
-0.27%
1 janv. 2014
162.604 mln.
+736.592 milles
0.46%
1 janv. 2015
158.91 mln.
-3.694 mln.
-2.27%
Classement des pays selon les statistiques actuelles par années


Commentaires: