29
/fr/
fr
AIzaSyAYiBZKx7MnpbEhh9jyipgxe19OcubqV5w
April 1, 2024
53027
OECD members
OED
false
2
1
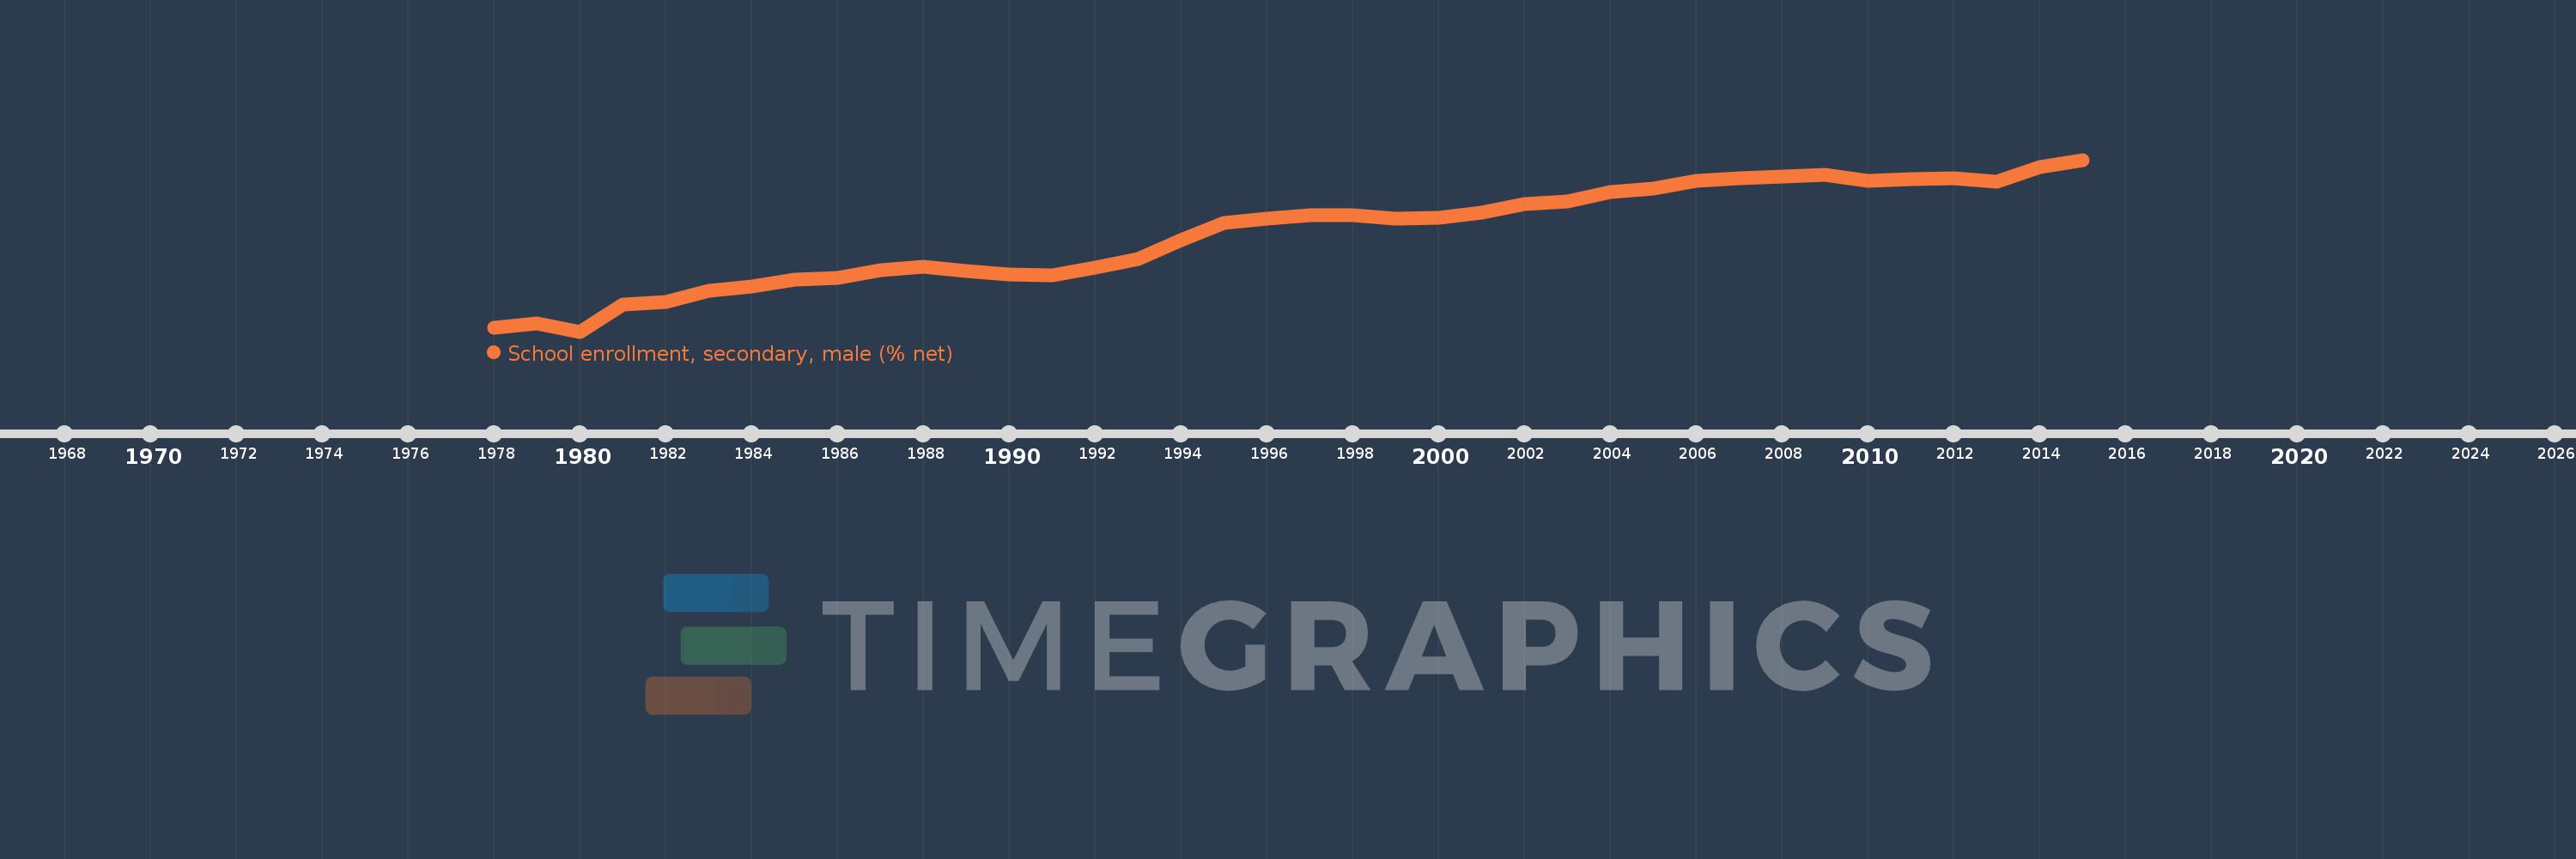
School enrollment, secondary, male (% net)
2015,2014,2013,2012,2011,2010,2009,2008,2007,2006,2005,2004,2003,2002,2001,2000,1999,1998,1997,1996,1995,1994,1993,1992,1991,1990,1989,1988,1987,1986,1985,1984,1983,1982,1981,1980,1979,1978
Cette statistique dans les autres pays:
AfghanistanAlbaniaAlgeriaAngolaAntigua and BarbudaArab WorldArgentinaArmeniaArubaAustraliaAzerbaijanBahamas, TheBahrainBangladeshBarbadosBelarusBelgiumBelizeBeninBermudaBhutanBoliviaBotswanaBrazilBrunei DarussalamBulgariaBurkina FasoBurundiCabo VerdeCambodiaCameroonCanadaCaribbean small statesCentral African RepublicCentral Europe and the BalticsChadChileColombiaComorosCongo, Dem. Rep.Congo, Rep.Costa RicaCroatiaCubaCyprusDenmarkDjiboutiDominicaDominican RepublicEarly-demographic dividendEast Asia & PacificEast Asia & Pacific (excluding high income)East Asia & Pacific (IDA & IBRD countries)EcuadorEgypt, Arab Rep.El SalvadorEquatorial GuineaEritreaEstoniaEthiopiaEuro areaEurope & Central AsiaEurope & Central Asia (excluding high income)Europe & Central Asia (IDA & IBRD countries)European UnionFijiFinlandFragile and conflict affected situationsFranceGambia, TheGeorgiaGhanaGreeceGrenadaGuatemalaGuineaGuinea-BissauGuyanaHeavily indebted poor countries (HIPC)High incomeHondurasHong Kong SAR, ChinaHungaryIBRD onlyIcelandIDA & IBRD totalIDA blendIDA onlyIDA totalIndiaIndonesiaIran, Islamic Rep.IraqIrelandIsraelItalyJamaicaJapanJordanKazakhstanKenyaKiribatiKorea, Rep.KuwaitKyrgyz RepublicLao PDRLate-demographic dividendLatin America & Caribbean Latin America & Caribbean (excluding high income)Latin America & the Caribbean (IDA & IBRD countries)LatviaLeast developed countries: UN classificationLebanonLesothoLibyaLiechtensteinLithuaniaLow & middle incomeLow incomeLower middle incomeLuxembourgMacao SAR, ChinaMacedonia, FYRMadagascarMalawiMaldivesMaliMaltaMarshall IslandsMauritaniaMauritiusMexicoMiddle East & North AfricaMiddle East & North Africa (excluding high income)Middle East & North Africa (IDA & IBRD countries)Middle incomeMoldovaMongoliaMoroccoMozambiqueMyanmarNamibiaNauruNepalNetherlandsNew ZealandNicaraguaNigerNorth AmericaNorwayOECD membersOmanOther small statesPacific island small statesPakistanPanamaParaguayPeruPhilippinesPolandPortugalPost-demographic dividendPre-demographic dividendPuerto RicoQatarRomaniaSamoaSao Tome and PrincipeSaudi ArabiaSenegalSerbiaSeychellesSierra LeoneSloveniaSmall statesSolomon IslandsSomaliaSouth AfricaSouth AsiaSouth Asia (IDA & IBRD)SpainSri LankaSt. Kitts and NevisSt. LuciaSt. Vincent and the GrenadinesSub-Saharan Africa Sub-Saharan Africa (excluding high income)Sub-Saharan Africa (IDA & IBRD countries)SurinameSwazilandSwedenSwitzerlandSyrian Arab RepublicTajikistanThailandTimor-LesteTogoTongaTrinidad and TobagoTunisiaTurkeyTuvaluUgandaUkraineUnited Arab EmiratesUnited KingdomUnited StatesUpper middle incomeUruguayVanuatuVenezuela, RBWest Bank and GazaWorldYemen, Rep.Zimbabwe La ligne de temps
Cette échelle de temps montre un graphique de 1978 année à 2015 année OECD members. Les données jusqu'à 1977 année ne sont pas présentés. Quantité d'observations actuelles selon dates: 38.
Source (désignation):
Les indicateurs du développement mondiale
Source (organisation):
United Nations Educational, Scientific, and Cultural Organization (UNESCO) Institute for Statistics.
Catégories:
Education, Gender
Dernière mise à jour
23 avr. 2017
Les indicateurs de changement de valeurs selon les années
Minimum:
70.284
1 janv. 1980
Maximum:
88.666
1 janv. 2015
Pour la date d''observation
Valeur
Changement absolu
Le changement par rapport à la valeur précédente
1 janv. 1978
70.722
+70.722
0.0%
1 janv. 1979
71.114
+0.392
0.55%
1 janv. 1980
70.284
-0.83
-1.17%
1 janv. 1981
73.213
+2.929
4.17%
1 janv. 1982
73.448
+0.235
0.32%
1 janv. 1983
74.663
+1.215
1.65%
1 janv. 1984
75.119
+0.456
0.61%
1 janv. 1985
75.872
+0.754
1.0%
1 janv. 1986
76.006
+0.133
0.18%
1 janv. 1987
76.842
+0.836
1.1%
1 janv. 1988
77.178
+0.336
0.44%
1 janv. 1989
76.767
-0.411
-0.53%
1 janv. 1990
76.377
-0.39
-0.51%
1 janv. 1991
76.269
-0.109
-0.14%
1 janv. 1992
77.148
+0.88
1.15%
1 janv. 1993
78.063
+0.915
1.19%
1 janv. 1994
80.028
+1.965
2.52%
1 janv. 1995
81.952
+1.924
2.4%
1 janv. 1996
82.396
+0.444
0.54%
1 janv. 1997
82.706
+0.311
0.38%
1 janv. 1998
82.757
+0.051
0.06%
1 janv. 1999
82.401
-0.356
-0.43%
1 janv. 2000
82.471
+0.07
0.09%
1 janv. 2001
83.01
+0.539
0.65%
1 janv. 2002
83.926
+0.916
1.1%
1 janv. 2003
84.226
+0.3
0.36%
1 janv. 2004
85.225
+0.999
1.19%
1 janv. 2005
85.61
+0.385
0.45%
1 janv. 2006
86.4
+0.79
0.92%
1 janv. 2007
86.714
+0.314
0.36%
1 janv. 2008
86.838
+0.124
0.14%
1 janv. 2009
87.074
+0.236
0.27%
1 janv. 2010
86.406
-0.668
-0.77%
1 janv. 2011
86.62
+0.214
0.25%
1 janv. 2012
86.715
+0.095
0.11%
1 janv. 2013
86.354
-0.361
-0.42%
1 janv. 2014
87.921
+1.567
1.81%
1 janv. 2015
88.666
+0.746
0.85%
Classement des pays selon les statistiques actuelles par années


Commentaires: