29
/fr/
fr
AIzaSyAYiBZKx7MnpbEhh9jyipgxe19OcubqV5w
April 1, 2024
36168
High income
HIC
false
2
1
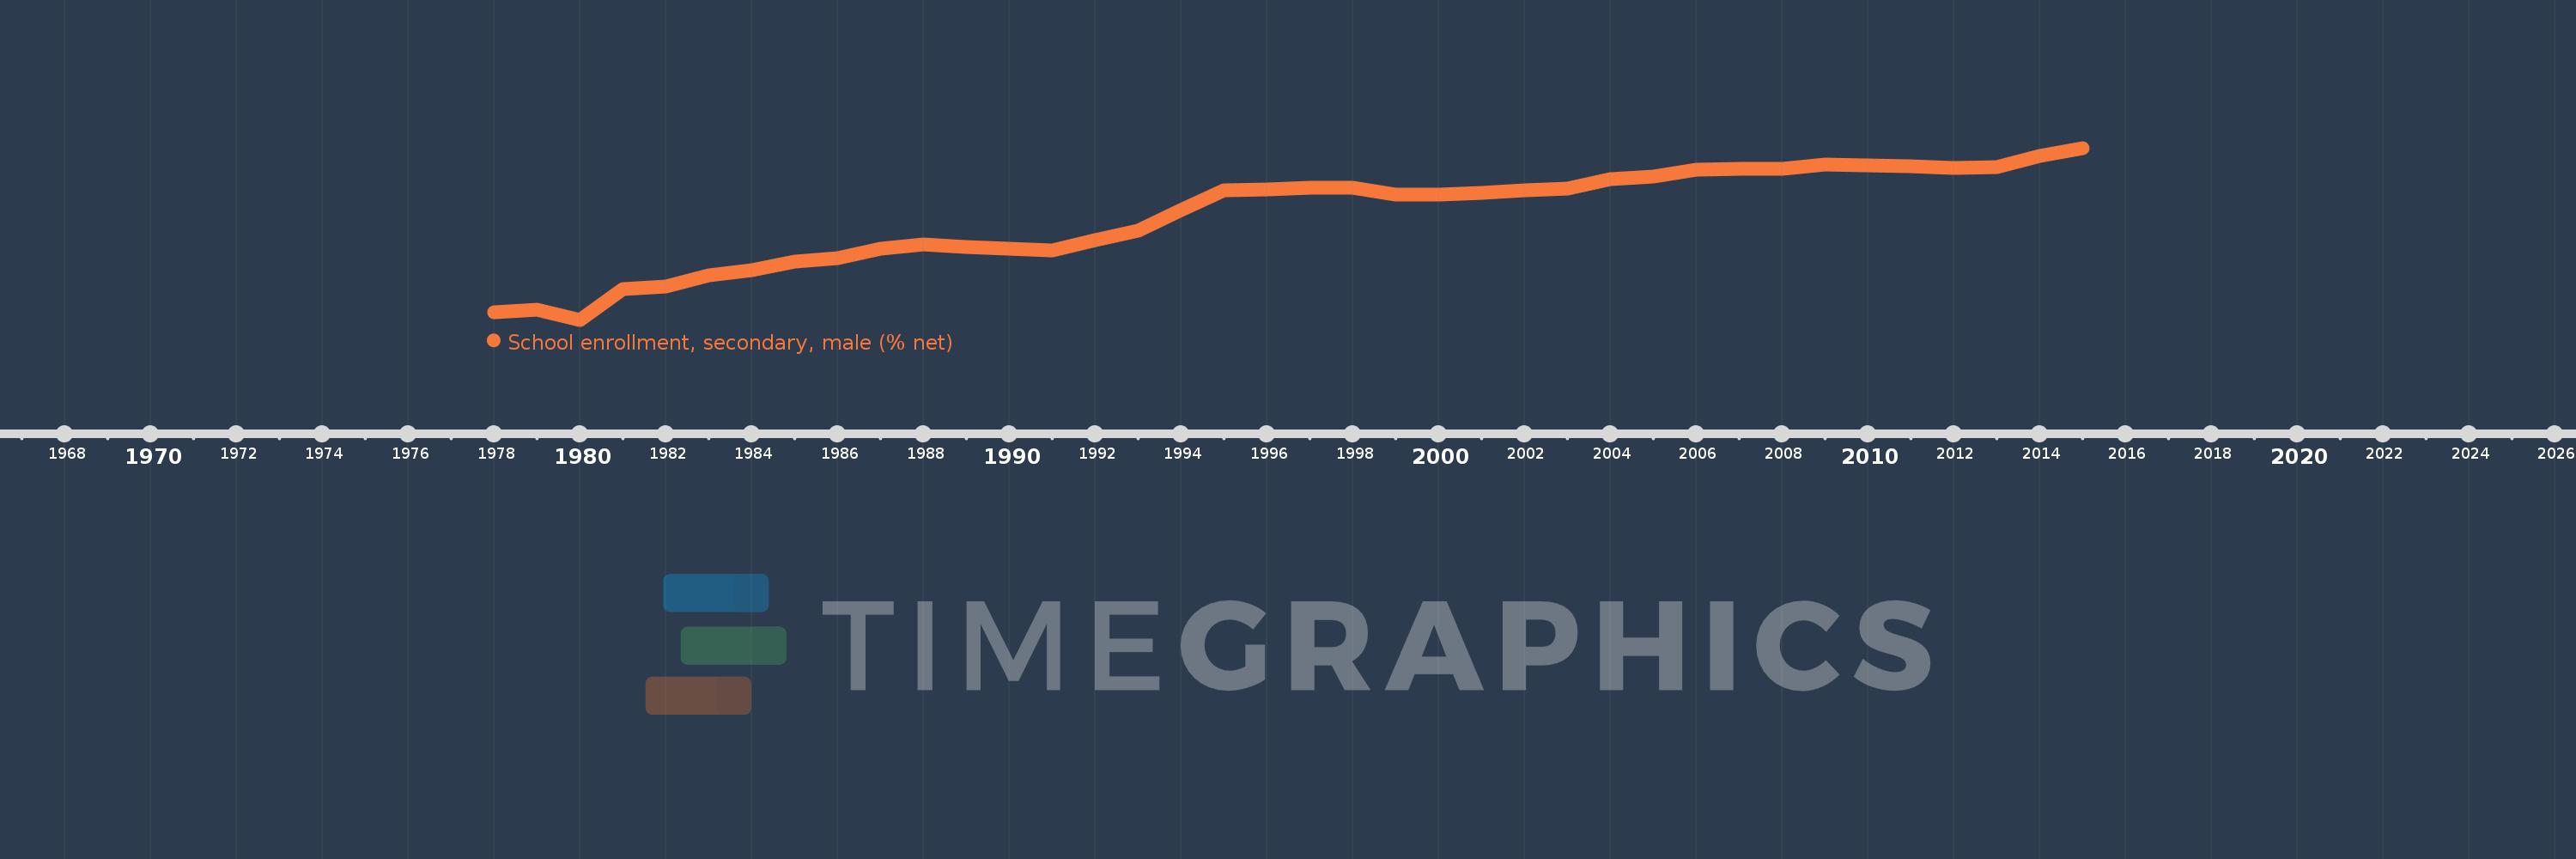
School enrollment, secondary, male (% net)
2015,2014,2013,2012,2011,2010,2009,2008,2007,2006,2005,2004,2003,2002,2001,2000,1999,1998,1997,1996,1995,1994,1993,1992,1991,1990,1989,1988,1987,1986,1985,1984,1983,1982,1981,1980,1979,1978
Cette statistique dans les autres pays:
AfghanistanAlbaniaAlgeriaAngolaAntigua and BarbudaArab WorldArgentinaArmeniaArubaAustraliaAzerbaijanBahamas, TheBahrainBangladeshBarbadosBelarusBelgiumBelizeBeninBermudaBhutanBoliviaBotswanaBrazilBrunei DarussalamBulgariaBurkina FasoBurundiCabo VerdeCambodiaCameroonCanadaCaribbean small statesCentral African RepublicCentral Europe and the BalticsChadChileColombiaComorosCongo, Dem. Rep.Congo, Rep.Costa RicaCroatiaCubaCyprusDenmarkDjiboutiDominicaDominican RepublicEarly-demographic dividendEast Asia & PacificEast Asia & Pacific (excluding high income)East Asia & Pacific (IDA & IBRD countries)EcuadorEgypt, Arab Rep.El SalvadorEquatorial GuineaEritreaEstoniaEthiopiaEuro areaEurope & Central AsiaEurope & Central Asia (excluding high income)Europe & Central Asia (IDA & IBRD countries)European UnionFijiFinlandFragile and conflict affected situationsFranceGambia, TheGeorgiaGhanaGreeceGrenadaGuatemalaGuineaGuinea-BissauGuyanaHeavily indebted poor countries (HIPC)High incomeHondurasHong Kong SAR, ChinaHungaryIBRD onlyIcelandIDA & IBRD totalIDA blendIDA onlyIDA totalIndiaIndonesiaIran, Islamic Rep.IraqIrelandIsraelItalyJamaicaJapanJordanKazakhstanKenyaKiribatiKorea, Rep.KuwaitKyrgyz RepublicLao PDRLate-demographic dividendLatin America & Caribbean Latin America & Caribbean (excluding high income)Latin America & the Caribbean (IDA & IBRD countries)LatviaLeast developed countries: UN classificationLebanonLesothoLibyaLiechtensteinLithuaniaLow & middle incomeLow incomeLower middle incomeLuxembourgMacao SAR, ChinaMacedonia, FYRMadagascarMalawiMaldivesMaliMaltaMarshall IslandsMauritaniaMauritiusMexicoMiddle East & North AfricaMiddle East & North Africa (excluding high income)Middle East & North Africa (IDA & IBRD countries)Middle incomeMoldovaMongoliaMoroccoMozambiqueMyanmarNamibiaNauruNepalNetherlandsNew ZealandNicaraguaNigerNorth AmericaNorwayOECD membersOmanOther small statesPacific island small statesPakistanPanamaParaguayPeruPhilippinesPolandPortugalPost-demographic dividendPre-demographic dividendPuerto RicoQatarRomaniaSamoaSao Tome and PrincipeSaudi ArabiaSenegalSerbiaSeychellesSierra LeoneSloveniaSmall statesSolomon IslandsSomaliaSouth AfricaSouth AsiaSouth Asia (IDA & IBRD)SpainSri LankaSt. Kitts and NevisSt. LuciaSt. Vincent and the GrenadinesSub-Saharan Africa Sub-Saharan Africa (excluding high income)Sub-Saharan Africa (IDA & IBRD countries)SurinameSwazilandSwedenSwitzerlandSyrian Arab RepublicTajikistanThailandTimor-LesteTogoTongaTrinidad and TobagoTunisiaTurkeyTuvaluUgandaUkraineUnited Arab EmiratesUnited KingdomUnited StatesUpper middle incomeUruguayVanuatuVenezuela, RBWest Bank and GazaWorldYemen, Rep.Zimbabwe La ligne de temps
Cette échelle de temps montre un graphique de 1978 année à 2015 année High income. Les données jusqu'à 1977 année ne sont pas présentés. Quantité d'observations actuelles selon dates: 38.
Source (désignation):
Les indicateurs du développement mondiale
Source (organisation):
United Nations Educational, Scientific, and Cultural Organization (UNESCO) Institute for Statistics.
Catégories:
Education, Gender
Dernière mise à jour
23 avr. 2017
Les indicateurs de changement de valeurs selon les années
Minimum:
74.206
1 janv. 1980
Maximum:
91.538
1 janv. 2015
Pour la date d''observation
Valeur
Changement absolu
Le changement par rapport à la valeur précédente
1 janv. 1978
74.924
+74.924
0.0%
1 janv. 1979
75.227
+0.302
0.4%
1 janv. 1980
74.206
-1.021
-1.36%
1 janv. 1981
77.284
+3.079
4.15%
1 janv. 1982
77.524
+0.239
0.31%
1 janv. 1983
78.67
+1.146
1.48%
1 janv. 1984
79.207
+0.537
0.68%
1 janv. 1985
80.074
+0.867
1.09%
1 janv. 1986
80.382
+0.308
0.38%
1 janv. 1987
81.403
+1.021
1.27%
1 janv. 1988
81.819
+0.416
0.51%
1 janv. 1989
81.517
-0.302
-0.37%
1 janv. 1990
81.347
-0.169
-0.21%
1 janv. 1991
81.222
-0.125
-0.15%
1 janv. 1992
82.239
+1.017
1.25%
1 janv. 1993
83.218
+0.979
1.19%
1 janv. 1994
85.236
+2.018
2.42%
1 janv. 1995
87.277
+2.041
2.39%
1 janv. 1996
87.393
+0.116
0.13%
1 janv. 1997
87.562
+0.169
0.19%
1 janv. 1998
87.533
-0.029
-0.03%
1 janv. 1999
86.844
-0.69
-0.79%
1 janv. 2000
86.833
-0.01
-0.01%
1 janv. 2001
86.975
+0.141
0.16%
1 janv. 2002
87.248
+0.273
0.31%
1 janv. 2003
87.473
+0.225
0.26%
1 janv. 2004
88.406
+0.934
1.07%
1 janv. 2005
88.617
+0.211
0.24%
1 janv. 2006
89.311
+0.694
0.78%
1 janv. 2007
89.426
+0.115
0.13%
1 janv. 2008
89.394
-0.032
-0.04%
1 janv. 2009
89.87
+0.476
0.53%
1 janv. 2010
89.741
-0.129
-0.14%
1 janv. 2011
89.669
-0.072
-0.08%
1 janv. 2012
89.546
-0.124
-0.14%
1 janv. 2013
89.591
+0.046
0.05%
1 janv. 2014
90.768
+1.177
1.31%
1 janv. 2015
91.538
+0.769
0.85%
Classement des pays selon les statistiques actuelles par années


Commentaires: