29
/fr/
fr
AIzaSyAYiBZKx7MnpbEhh9jyipgxe19OcubqV5w
April 1, 2024
24508
Arab World
ARB
false
2
1
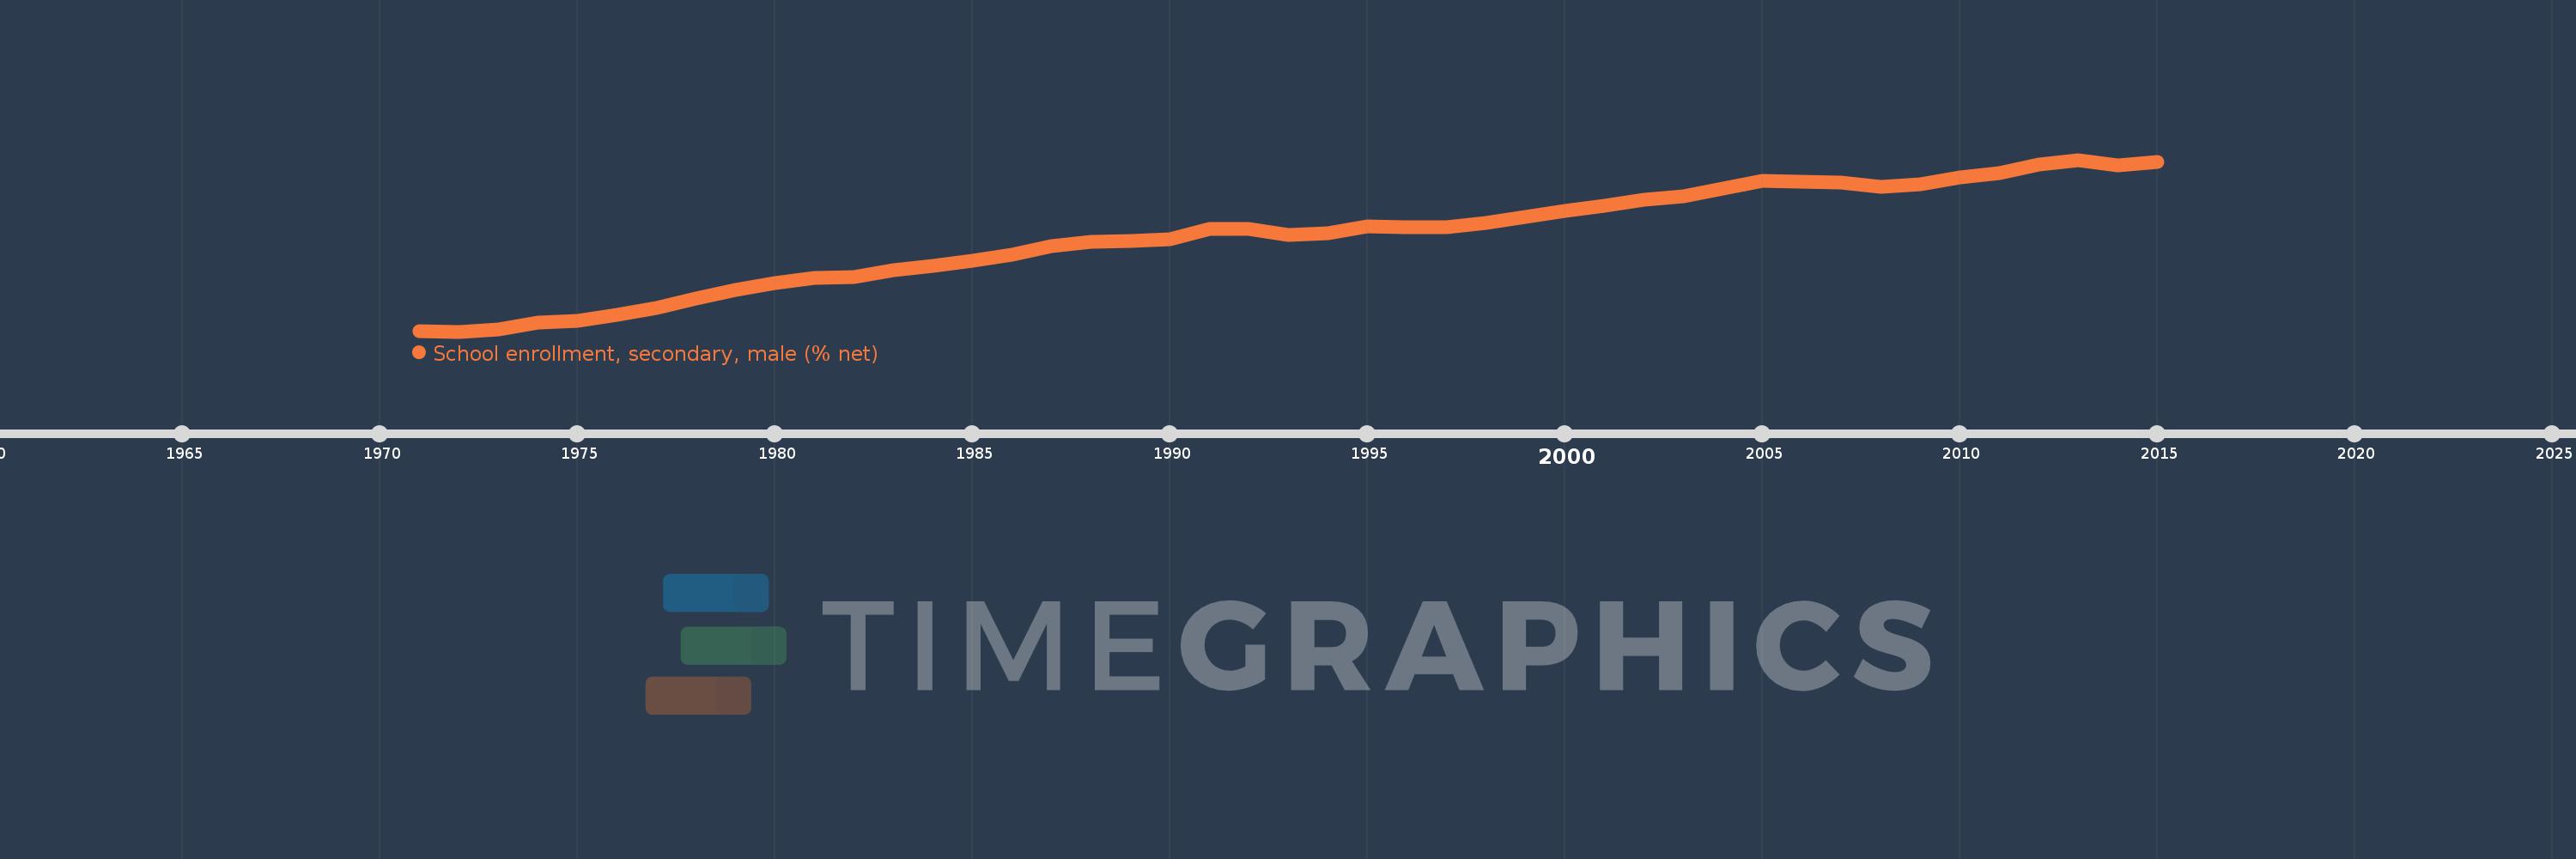
School enrollment, secondary, male (% net)
2015,2014,2013,2012,2011,2010,2009,2008,2007,2006,2005,2004,2003,2002,2001,2000,1999,1998,1997,1996,1995,1994,1993,1992,1991,1990,1989,1988,1987,1986,1985,1984,1983,1982,1981,1980,1979,1978,1977,1976,1975,1974,1973,1972,1971
Cette statistique dans les autres pays:
AfghanistanAlbaniaAlgeriaAngolaAntigua and BarbudaArab WorldArgentinaArmeniaArubaAustraliaAzerbaijanBahamas, TheBahrainBangladeshBarbadosBelarusBelgiumBelizeBeninBermudaBhutanBoliviaBotswanaBrazilBrunei DarussalamBulgariaBurkina FasoBurundiCabo VerdeCambodiaCameroonCanadaCaribbean small statesCentral African RepublicCentral Europe and the BalticsChadChileColombiaComorosCongo, Dem. Rep.Congo, Rep.Costa RicaCroatiaCubaCyprusDenmarkDjiboutiDominicaDominican RepublicEarly-demographic dividendEast Asia & PacificEast Asia & Pacific (excluding high income)East Asia & Pacific (IDA & IBRD countries)EcuadorEgypt, Arab Rep.El SalvadorEquatorial GuineaEritreaEstoniaEthiopiaEuro areaEurope & Central AsiaEurope & Central Asia (excluding high income)Europe & Central Asia (IDA & IBRD countries)European UnionFijiFinlandFragile and conflict affected situationsFranceGambia, TheGeorgiaGhanaGreeceGrenadaGuatemalaGuineaGuinea-BissauGuyanaHeavily indebted poor countries (HIPC)High incomeHondurasHong Kong SAR, ChinaHungaryIBRD onlyIcelandIDA & IBRD totalIDA blendIDA onlyIDA totalIndiaIndonesiaIran, Islamic Rep.IraqIrelandIsraelItalyJamaicaJapanJordanKazakhstanKenyaKiribatiKorea, Rep.KuwaitKyrgyz RepublicLao PDRLate-demographic dividendLatin America & Caribbean Latin America & Caribbean (excluding high income)Latin America & the Caribbean (IDA & IBRD countries)LatviaLeast developed countries: UN classificationLebanonLesothoLibyaLiechtensteinLithuaniaLow & middle incomeLow incomeLower middle incomeLuxembourgMacao SAR, ChinaMacedonia, FYRMadagascarMalawiMaldivesMaliMaltaMarshall IslandsMauritaniaMauritiusMexicoMiddle East & North AfricaMiddle East & North Africa (excluding high income)Middle East & North Africa (IDA & IBRD countries)Middle incomeMoldovaMongoliaMoroccoMozambiqueMyanmarNamibiaNauruNepalNetherlandsNew ZealandNicaraguaNigerNorth AmericaNorwayOECD membersOmanOther small statesPacific island small statesPakistanPanamaParaguayPeruPhilippinesPolandPortugalPost-demographic dividendPre-demographic dividendPuerto RicoQatarRomaniaSamoaSao Tome and PrincipeSaudi ArabiaSenegalSerbiaSeychellesSierra LeoneSloveniaSmall statesSolomon IslandsSomaliaSouth AfricaSouth AsiaSouth Asia (IDA & IBRD)SpainSri LankaSt. Kitts and NevisSt. LuciaSt. Vincent and the GrenadinesSub-Saharan Africa Sub-Saharan Africa (excluding high income)Sub-Saharan Africa (IDA & IBRD countries)SurinameSwazilandSwedenSwitzerlandSyrian Arab RepublicTajikistanThailandTimor-LesteTogoTongaTrinidad and TobagoTunisiaTurkeyTuvaluUgandaUkraineUnited Arab EmiratesUnited KingdomUnited StatesUpper middle incomeUruguayVanuatuVenezuela, RBWest Bank and GazaWorldYemen, Rep.Zimbabwe La ligne de temps
Cette échelle de temps montre un graphique de 1971 année à 2015 année Arab World. Les données jusqu'à 1970 année ne sont pas présentés. Quantité d'observations actuelles selon dates: 45.
Source (désignation):
Les indicateurs du développement mondiale
Source (organisation):
United Nations Educational, Scientific, and Cultural Organization (UNESCO) Institute for Statistics.
Catégories:
Education, Gender
Dernière mise à jour
23 avr. 2017
Les indicateurs de changement de valeurs selon les années
Minimum:
26.024
1 janv. 1972
Maximum:
65.975
1 janv. 2013
Pour la date d''observation
Valeur
Changement absolu
Le changement par rapport à la valeur précédente
1 janv. 1971
26.114
+26.114
0.0%
1 janv. 1972
26.024
-0.09
-0.35%
1 janv. 1973
26.518
+0.494
1.9%
1 janv. 1974
28.129
+1.611
6.07%
1 janv. 1975
28.568
+0.439
1.56%
1 janv. 1976
29.977
+1.409
4.93%
1 janv. 1977
31.595
+1.618
5.4%
1 janv. 1978
33.7
+2.104
6.66%
1 janv. 1979
35.764
+2.064
6.12%
1 janv. 1980
37.329
+1.565
4.38%
1 janv. 1981
38.437
+1.109
2.97%
1 janv. 1982
38.733
+0.295
0.77%
1 janv. 1983
40.276
+1.544
3.99%
1 janv. 1984
41.361
+1.085
2.69%
1 janv. 1985
42.553
+1.191
2.88%
1 janv. 1986
43.99
+1.437
3.38%
1 janv. 1987
45.84
+1.851
4.21%
1 janv. 1988
46.832
+0.991
2.16%
1 janv. 1989
47.055
+0.223
0.48%
1 janv. 1990
47.53
+0.475
1.01%
1 janv. 1991
49.975
+2.445
5.14%
1 janv. 1992
49.865
-0.11
-0.22%
1 janv. 1993
48.472
-1.394
-2.8%
1 janv. 1994
48.804
+0.333
0.69%
1 janv. 1995
50.458
+1.653
3.39%
1 janv. 1996
50.338
-0.119
-0.24%
1 janv. 1997
50.225
-0.113
-0.22%
1 janv. 1998
51.21
+0.985
1.96%
1 janv. 1999
52.623
+1.413
2.76%
1 janv. 2000
54.012
+1.389
2.64%
1 janv. 2001
55.302
+1.29
2.39%
1 janv. 2002
56.627
+1.325
2.4%
1 janv. 2003
57.518
+0.891
1.57%
1 janv. 2004
59.229
+1.711
2.97%
1 janv. 2005
61.056
+1.828
3.09%
1 janv. 2006
60.934
-0.123
-0.2%
1 janv. 2007
60.653
-0.28
-0.46%
1 janv. 2008
59.643
-1.01
-1.67%
1 janv. 2009
60.184
+0.541
0.91%
1 janv. 2010
61.822
+1.638
2.72%
1 janv. 2011
62.921
+1.099
1.78%
1 janv. 2012
64.915
+1.995
3.17%
1 janv. 2013
65.975
+1.06
1.63%
1 janv. 2014
64.593
-1.382
-2.09%
1 janv. 2015
65.413
+0.82
1.27%
Classement des pays selon les statistiques actuelles par années


Commentaires: