29
/fr/
fr
AIzaSyAYiBZKx7MnpbEhh9jyipgxe19OcubqV5w
April 1, 2024
52639
OECD members
OED
false
2
1
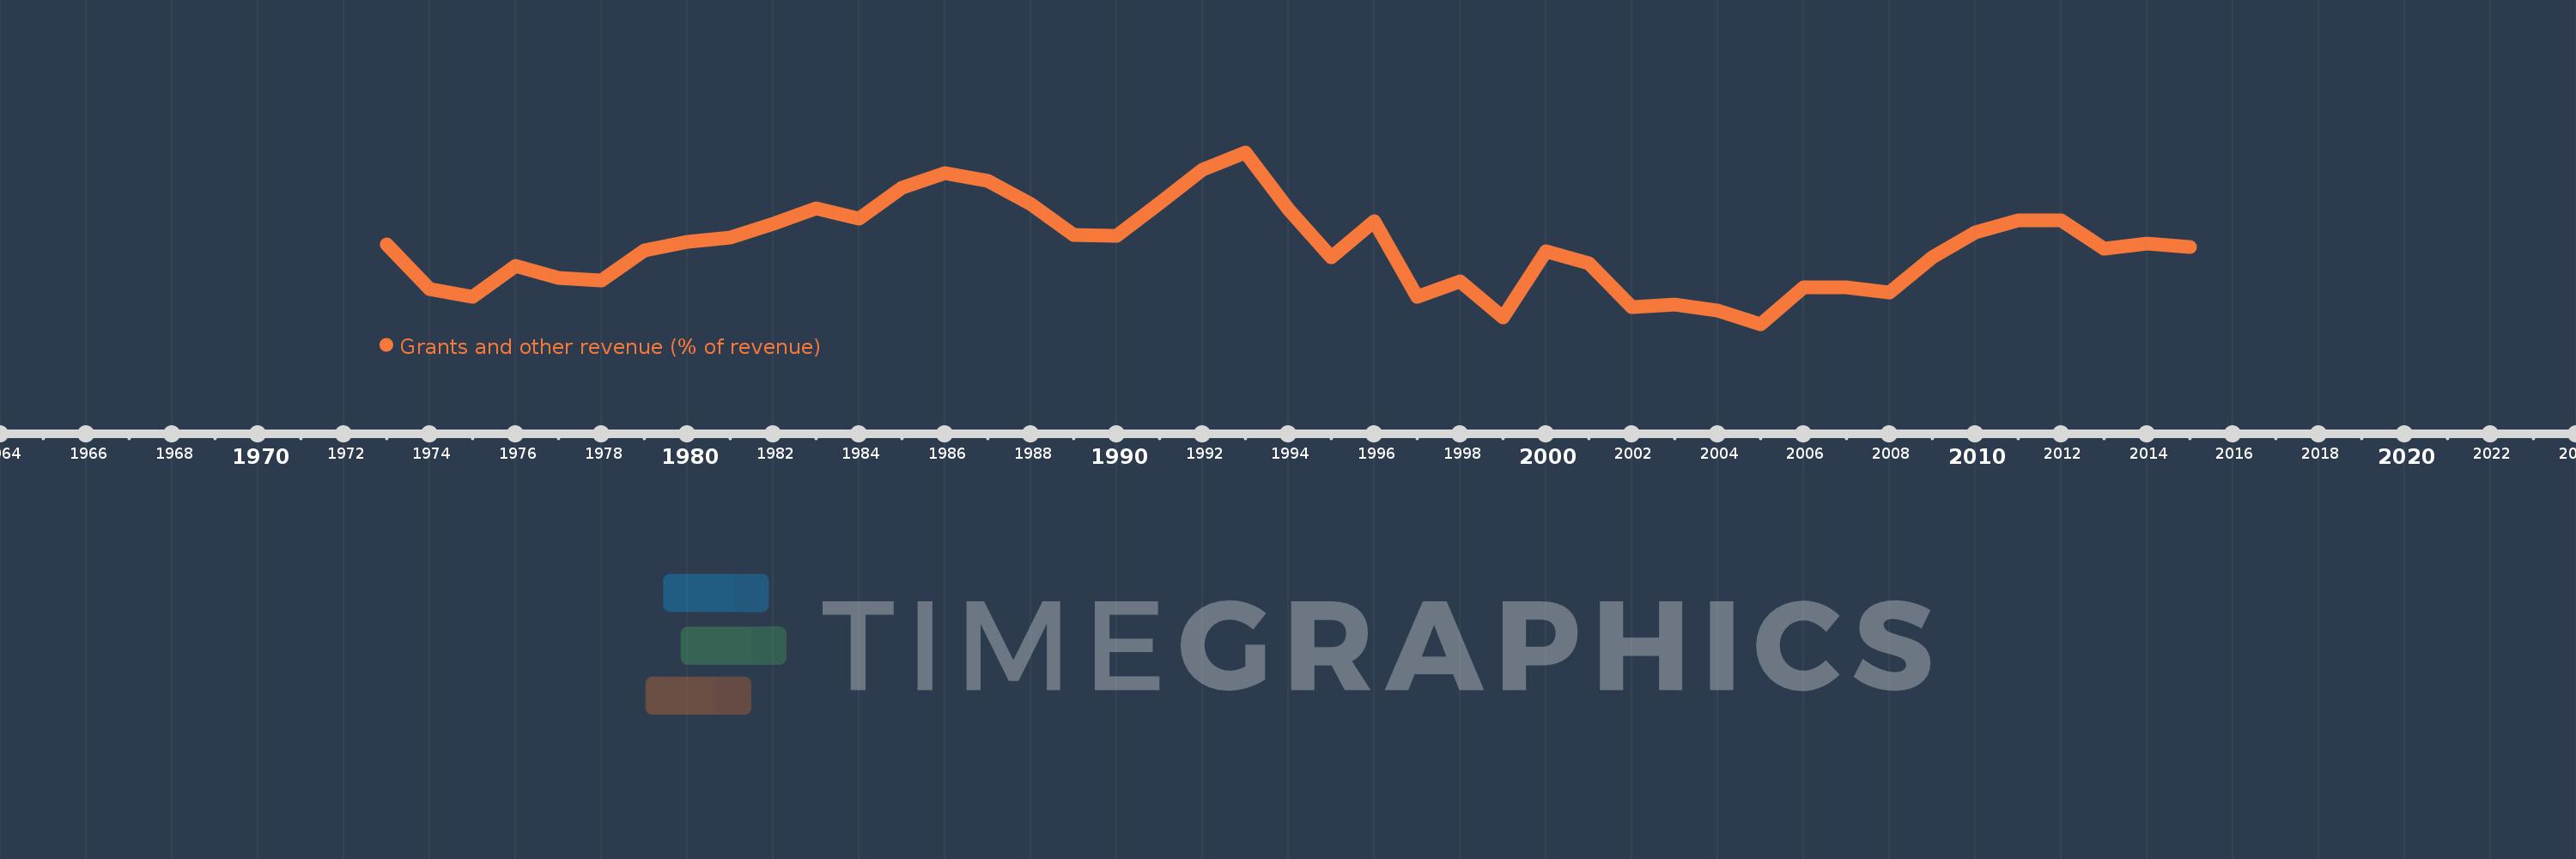
Grants and other revenue (% of revenue)
2015,2014,2013,2012,2011,2010,2009,2008,2007,2006,2005,2004,2003,2002,2001,2000,1999,1998,1997,1996,1995,1994,1993,1992,1991,1990,1989,1988,1987,1986,1985,1984,1983,1982,1981,1980,1979,1978,1977,1976,1975,1974,1973
Cette statistique dans les autres pays:
AfghanistanAlbaniaAlgeriaAngolaAntigua and BarbudaArab WorldArgentinaArmeniaAustraliaAustriaAzerbaijanBahamas, TheBahrainBangladeshBarbadosBelarusBelgiumBelizeBeninBhutanBoliviaBosnia and HerzegovinaBotswanaBrazilBulgariaBurkina FasoBurundiCabo VerdeCambodiaCanadaCaribbean small statesCentral African RepublicCentral Europe and the BalticsChileChinaColombiaCongo, Dem. Rep.Congo, Rep.Costa RicaCote d'IvoireCroatiaCyprusCzech RepublicDenmarkDominicaDominican RepublicEarly-demographic dividendEast Asia & PacificEast Asia & Pacific (excluding high income)East Asia & Pacific (IDA & IBRD countries)Egypt, Arab Rep.El SalvadorEquatorial GuineaEstoniaEthiopiaEuro areaEurope & Central AsiaEurope & Central Asia (excluding high income)Europe & Central Asia (IDA & IBRD countries)European UnionFijiFinlandFranceGambia, TheGeorgiaGermanyGhanaGreeceGrenadaGuatemalaHeavily indebted poor countries (HIPC)High incomeHondurasHong Kong SAR, ChinaHungaryIBRD onlyIcelandIDA & IBRD totalIDA blendIDA onlyIDA totalIndiaIndonesiaIran, Islamic Rep.IraqIrelandIsraelItalyJamaicaJapanJordanKazakhstanKenyaKiribatiKorea, Rep.KuwaitKyrgyz RepublicLao PDRLate-demographic dividendLatin America & Caribbean Latin America & Caribbean (excluding high income)Latin America & the Caribbean (IDA & IBRD countries)LatviaLeast developed countries: UN classificationLebanonLesothoLiberiaLithuaniaLow & middle incomeLow incomeLower middle incomeLuxembourgMacao SAR, ChinaMacedonia, FYRMadagascarMalawiMalaysiaMaldivesMaliMaltaMauritiusMexicoMicronesia, Fed. Sts.Middle East & North AfricaMiddle East & North Africa (excluding high income)Middle East & North Africa (IDA & IBRD countries)Middle incomeMoldovaMongoliaMoroccoMozambiqueMyanmarNamibiaNepalNetherlandsNew ZealandNicaraguaNigeriaNorth AmericaNorwayOECD membersOmanOther small statesPakistanPanamaPapua New GuineaParaguayPeruPhilippinesPolandPortugalPost-demographic dividendPre-demographic dividendQatarRomaniaRussian FederationRwandaSamoaSan MarinoSao Tome and PrincipeSenegalSerbiaSeychellesSierra LeoneSingaporeSlovak RepublicSloveniaSmall statesSolomon IslandsSouth AfricaSouth AsiaSouth Asia (IDA & IBRD)SpainSri LankaSt. Kitts and NevisSt. LuciaSt. Vincent and the GrenadinesSub-Saharan Africa Sub-Saharan Africa (excluding high income)Sub-Saharan Africa (IDA & IBRD countries)SurinameSwazilandSwedenSwitzerlandSyrian Arab RepublicTajikistanTanzaniaThailandTimor-LesteTogoTrinidad and TobagoTunisiaTurkeyUgandaUkraineUnited Arab EmiratesUnited KingdomUnited StatesUpper middle incomeUruguayVanuatuVenezuela, RBVietnamWest Bank and GazaWorldYemen, Rep.ZambiaZimbabwe La ligne de temps
Cette échelle de temps montre un graphique de 1973 année à 2015 année OECD members. Les données jusqu'à 1972 année ne sont pas présentés. Quantité d'observations actuelles selon dates: 43.
Source (désignation):
Les indicateurs du développement mondiale
Source (organisation):
International Monetary Fund, Government Finance Statistics Yearbook and data files.
Catégories:
Public Sector
Dernière mise à jour
23 avr. 2017
Les indicateurs de changement de valeurs selon les années
Minimum:
8.163
1 janv. 2005
Maximum:
12.11
1 janv. 1993
Pour la date d''observation
Valeur
Changement absolu
Le changement par rapport à la valeur précédente
1 janv. 1973
10.0
+10.0
0.0%
1 janv. 1974
8.973
-1.027
-10.27%
1 janv. 1975
8.799
-0.174
-1.94%
1 janv. 1976
9.504
+0.705
8.01%
1 janv. 1977
9.228
-0.275
-2.9%
1 janv. 1978
9.16
-0.068
-0.74%
1 janv. 1979
9.853
+0.693
7.56%
1 janv. 1980
10.054
+0.201
2.04%
1 janv. 1981
10.163
+0.109
1.09%
1 janv. 1982
10.466
+0.303
2.98%
1 janv. 1983
10.834
+0.368
3.52%
1 janv. 1984
10.597
-0.237
-2.19%
1 janv. 1985
11.304
+0.707
6.67%
1 janv. 1986
11.629
+0.324
2.87%
1 janv. 1987
11.46
-0.168
-1.45%
1 janv. 1988
10.928
-0.532
-4.64%
1 janv. 1989
10.206
-0.723
-6.61%
1 janv. 1990
10.199
-0.006
-0.06%
1 janv. 1991
10.935
+0.736
7.21%
1 janv. 1992
11.72
+0.785
7.18%
1 janv. 1993
12.11
+0.39
3.32%
1 janv. 1994
10.801
-1.309
-10.81%
1 janv. 1995
9.7
-1.101
-10.19%
1 janv. 1996
10.526
+0.827
8.52%
1 janv. 1997
8.786
-1.74
-16.53%
1 janv. 1998
9.153
+0.367
4.18%
1 janv. 1999
8.316
-0.837
-9.15%
1 janv. 2000
9.846
+1.531
18.41%
1 janv. 2001
9.572
-0.275
-2.79%
1 janv. 2002
8.55
-1.022
-10.67%
1 janv. 2003
8.614
+0.064
0.75%
1 janv. 2004
8.477
-0.138
-1.6%
1 janv. 2005
8.163
-0.314
-3.71%
1 janv. 2006
9.012
+0.85
10.41%
1 janv. 2007
9.01
-0.002
-0.02%
1 janv. 2008
8.898
-0.112
-1.24%
1 janv. 2009
9.695
+0.796
8.95%
1 janv. 2010
10.271
+0.576
5.94%
1 janv. 2011
10.554
+0.283
2.75%
1 janv. 2012
10.544
-0.009
-0.09%
1 janv. 2013
9.896
-0.648
-6.15%
1 janv. 2014
10.02
+0.124
1.26%
1 janv. 2015
9.947
-0.073
-0.73%
Classement des pays selon les statistiques actuelles par années


Commentaires: