29
/fr/
fr
AIzaSyAYiBZKx7MnpbEhh9jyipgxe19OcubqV5w
April 1, 2024
35768
High income
HIC
false
2
1
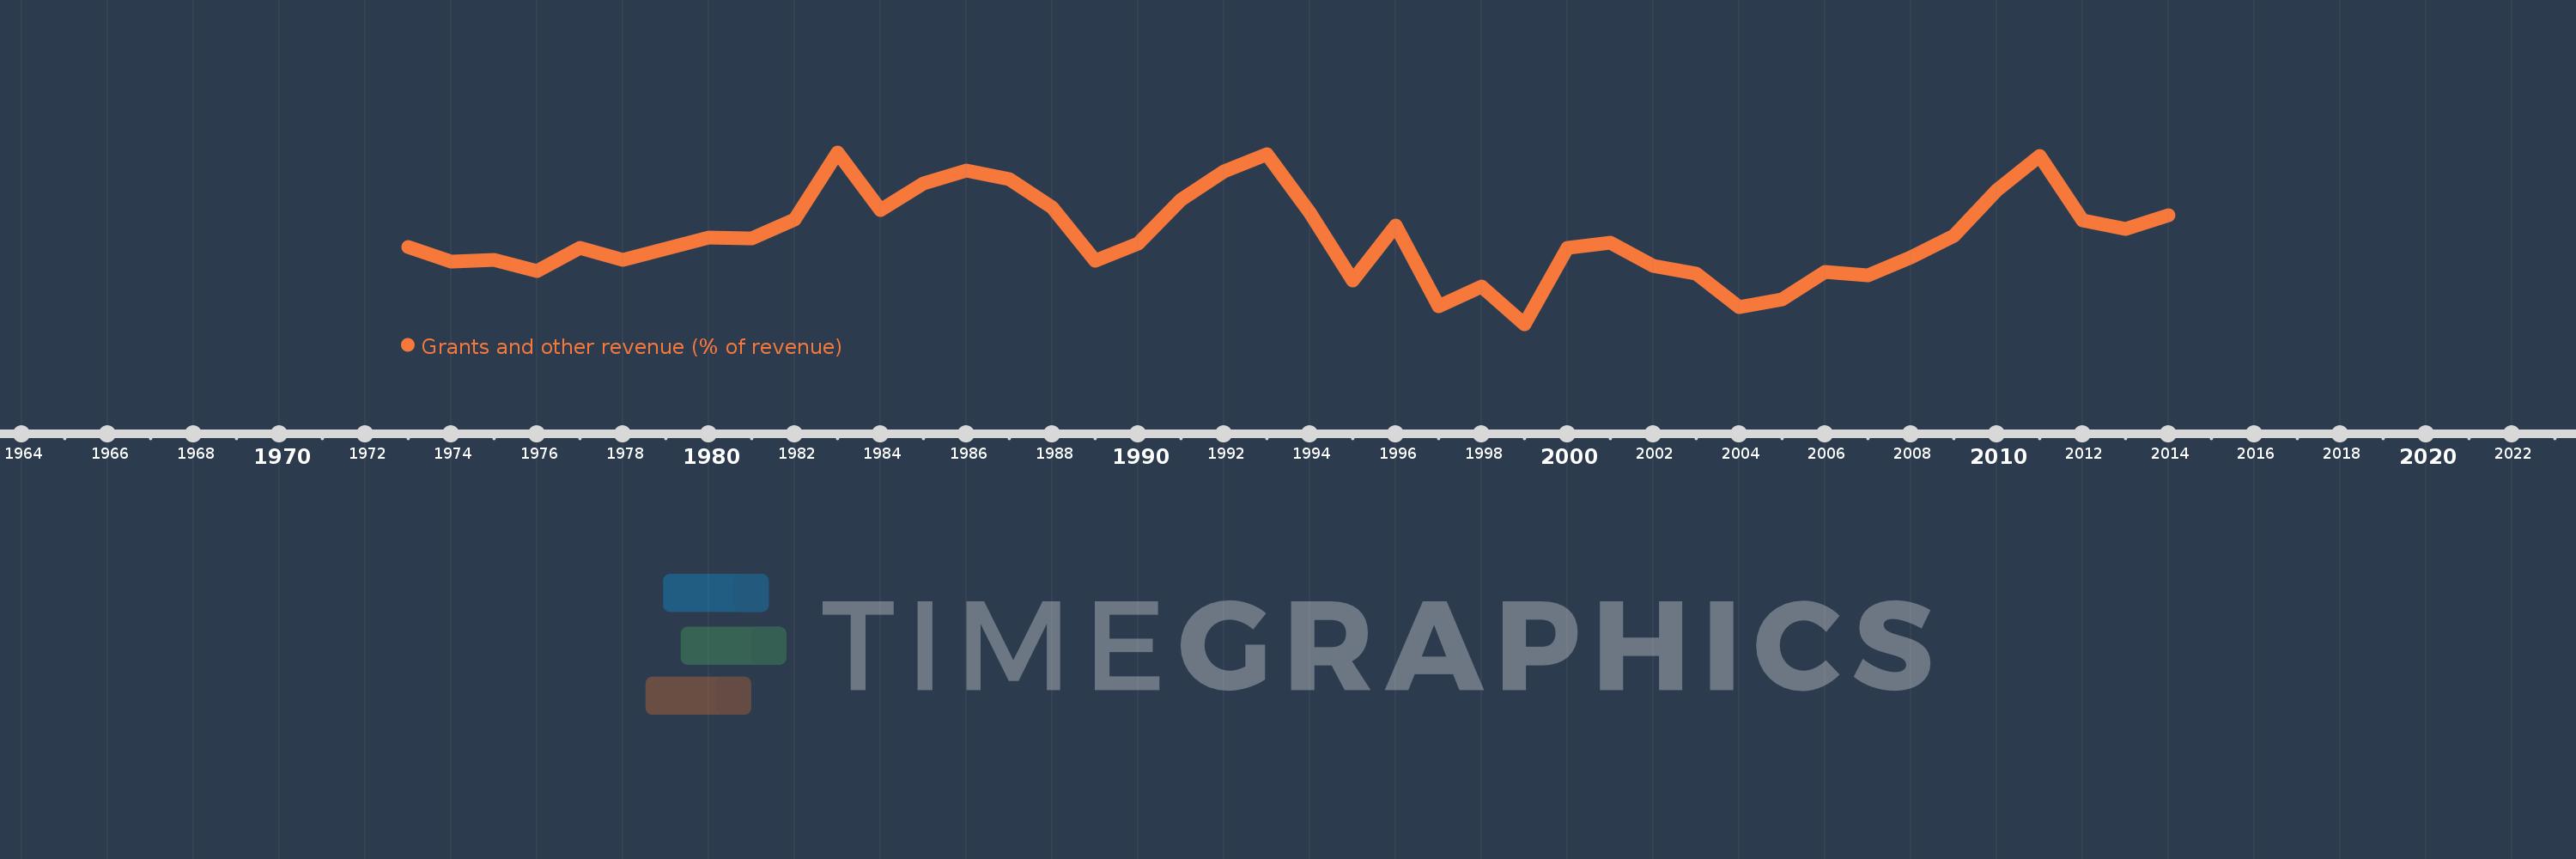
Grants and other revenue (% of revenue)
2014,2013,2012,2011,2010,2009,2008,2007,2006,2005,2004,2003,2002,2001,2000,1999,1998,1997,1996,1995,1994,1993,1992,1991,1990,1989,1988,1987,1986,1985,1984,1983,1982,1981,1980,1979,1978,1977,1976,1975,1974,1973
Cette statistique dans les autres pays:
AfghanistanAlbaniaAlgeriaAngolaAntigua and BarbudaArab WorldArgentinaArmeniaAustraliaAustriaAzerbaijanBahamas, TheBahrainBangladeshBarbadosBelarusBelgiumBelizeBeninBhutanBoliviaBosnia and HerzegovinaBotswanaBrazilBulgariaBurkina FasoBurundiCabo VerdeCambodiaCanadaCaribbean small statesCentral African RepublicCentral Europe and the BalticsChileChinaColombiaCongo, Dem. Rep.Congo, Rep.Costa RicaCote d'IvoireCroatiaCyprusCzech RepublicDenmarkDominicaDominican RepublicEarly-demographic dividendEast Asia & PacificEast Asia & Pacific (excluding high income)East Asia & Pacific (IDA & IBRD countries)Egypt, Arab Rep.El SalvadorEquatorial GuineaEstoniaEthiopiaEuro areaEurope & Central AsiaEurope & Central Asia (excluding high income)Europe & Central Asia (IDA & IBRD countries)European UnionFijiFinlandFranceGambia, TheGeorgiaGermanyGhanaGreeceGrenadaGuatemalaHeavily indebted poor countries (HIPC)High incomeHondurasHong Kong SAR, ChinaHungaryIBRD onlyIcelandIDA & IBRD totalIDA blendIDA onlyIDA totalIndiaIndonesiaIran, Islamic Rep.IraqIrelandIsraelItalyJamaicaJapanJordanKazakhstanKenyaKiribatiKorea, Rep.KuwaitKyrgyz RepublicLao PDRLate-demographic dividendLatin America & Caribbean Latin America & Caribbean (excluding high income)Latin America & the Caribbean (IDA & IBRD countries)LatviaLeast developed countries: UN classificationLebanonLesothoLiberiaLithuaniaLow & middle incomeLow incomeLower middle incomeLuxembourgMacao SAR, ChinaMacedonia, FYRMadagascarMalawiMalaysiaMaldivesMaliMaltaMauritiusMexicoMicronesia, Fed. Sts.Middle East & North AfricaMiddle East & North Africa (excluding high income)Middle East & North Africa (IDA & IBRD countries)Middle incomeMoldovaMongoliaMoroccoMozambiqueMyanmarNamibiaNepalNetherlandsNew ZealandNicaraguaNigeriaNorth AmericaNorwayOECD membersOmanOther small statesPakistanPanamaPapua New GuineaParaguayPeruPhilippinesPolandPortugalPost-demographic dividendPre-demographic dividendQatarRomaniaRussian FederationRwandaSamoaSan MarinoSao Tome and PrincipeSenegalSerbiaSeychellesSierra LeoneSingaporeSlovak RepublicSloveniaSmall statesSolomon IslandsSouth AfricaSouth AsiaSouth Asia (IDA & IBRD)SpainSri LankaSt. Kitts and NevisSt. LuciaSt. Vincent and the GrenadinesSub-Saharan Africa Sub-Saharan Africa (excluding high income)Sub-Saharan Africa (IDA & IBRD countries)SurinameSwazilandSwedenSwitzerlandSyrian Arab RepublicTajikistanTanzaniaThailandTimor-LesteTogoTrinidad and TobagoTunisiaTurkeyUgandaUkraineUnited Arab EmiratesUnited KingdomUnited StatesUpper middle incomeUruguayVanuatuVenezuela, RBVietnamWest Bank and GazaWorldYemen, Rep.ZambiaZimbabwe La ligne de temps
Cette échelle de temps montre un graphique de 1973 année à 2014 année High income. Les données jusqu'à 1972 année ne sont pas présentés. Quantité d'observations actuelles selon dates: 42.
Source (désignation):
Les indicateurs du développement mondiale
Source (organisation):
International Monetary Fund, Government Finance Statistics Yearbook and data files.
Catégories:
Public Sector
Dernière mise à jour
23 avr. 2017
Les indicateurs de changement de valeurs selon les années
Minimum:
8.316
1 janv. 1999
Maximum:
12.151
1 janv. 1983
Pour la date d''observation
Valeur
Changement absolu
Le changement par rapport à la valeur précédente
1 janv. 1973
10.042
+10.042
0.0%
1 janv. 1974
9.719
-0.323
-3.22%
1 janv. 1975
9.748
+0.03
0.3%
1 janv. 1976
9.504
-0.245
-2.51%
1 janv. 1977
10.03
+0.527
5.54%
1 janv. 1978
9.752
-0.279
-2.78%
1 janv. 1979
9.997
+0.245
2.51%
1 janv. 1980
10.249
+0.252
2.53%
1 janv. 1981
10.235
-0.014
-0.14%
1 janv. 1982
10.659
+0.424
4.14%
1 janv. 1983
12.151
+1.492
13.99%
1 janv. 1984
10.862
-1.289
-10.61%
1 janv. 1985
11.454
+0.592
5.45%
1 janv. 1986
11.737
+0.283
2.47%
1 janv. 1987
11.556
-0.181
-1.54%
1 janv. 1988
10.928
-0.627
-5.43%
1 janv. 1989
9.728
-1.201
-10.99%
1 janv. 1990
10.112
+0.385
3.95%
1 janv. 1991
11.088
+0.975
9.64%
1 janv. 1992
11.72
+0.633
5.71%
1 janv. 1993
12.11
+0.39
3.32%
1 janv. 1994
10.801
-1.309
-10.81%
1 janv. 1995
9.292
-1.509
-13.97%
1 janv. 1996
10.526
+1.235
13.29%
1 janv. 1997
8.72
-1.807
-17.16%
1 janv. 1998
9.153
+0.433
4.97%
1 janv. 1999
8.316
-0.837
-9.15%
1 janv. 2000
10.016
+1.701
20.45%
1 janv. 2001
10.141
+0.125
1.25%
1 janv. 2002
9.614
-0.528
-5.2%
1 janv. 2003
9.439
-0.175
-1.82%
1 janv. 2004
8.698
-0.741
-7.85%
1 janv. 2005
8.861
+0.163
1.87%
1 janv. 2006
9.478
+0.617
6.97%
1 janv. 2007
9.413
-0.065
-0.69%
1 janv. 2008
9.809
+0.396
4.2%
1 janv. 2009
10.287
+0.478
4.88%
1 janv. 2010
11.3
+1.013
9.85%
1 janv. 2011
12.064
+0.763
6.75%
1 janv. 2012
10.63
-1.434
-11.89%
1 janv. 2013
10.435
-0.195
-1.83%
1 janv. 2014
10.75
+0.315
3.02%
Classement des pays selon les statistiques actuelles par années


Commentaires: