29
/fr/
fr
AIzaSyAYiBZKx7MnpbEhh9jyipgxe19OcubqV5w
April 1, 2024
104912
Chile
CHL
true
2
1
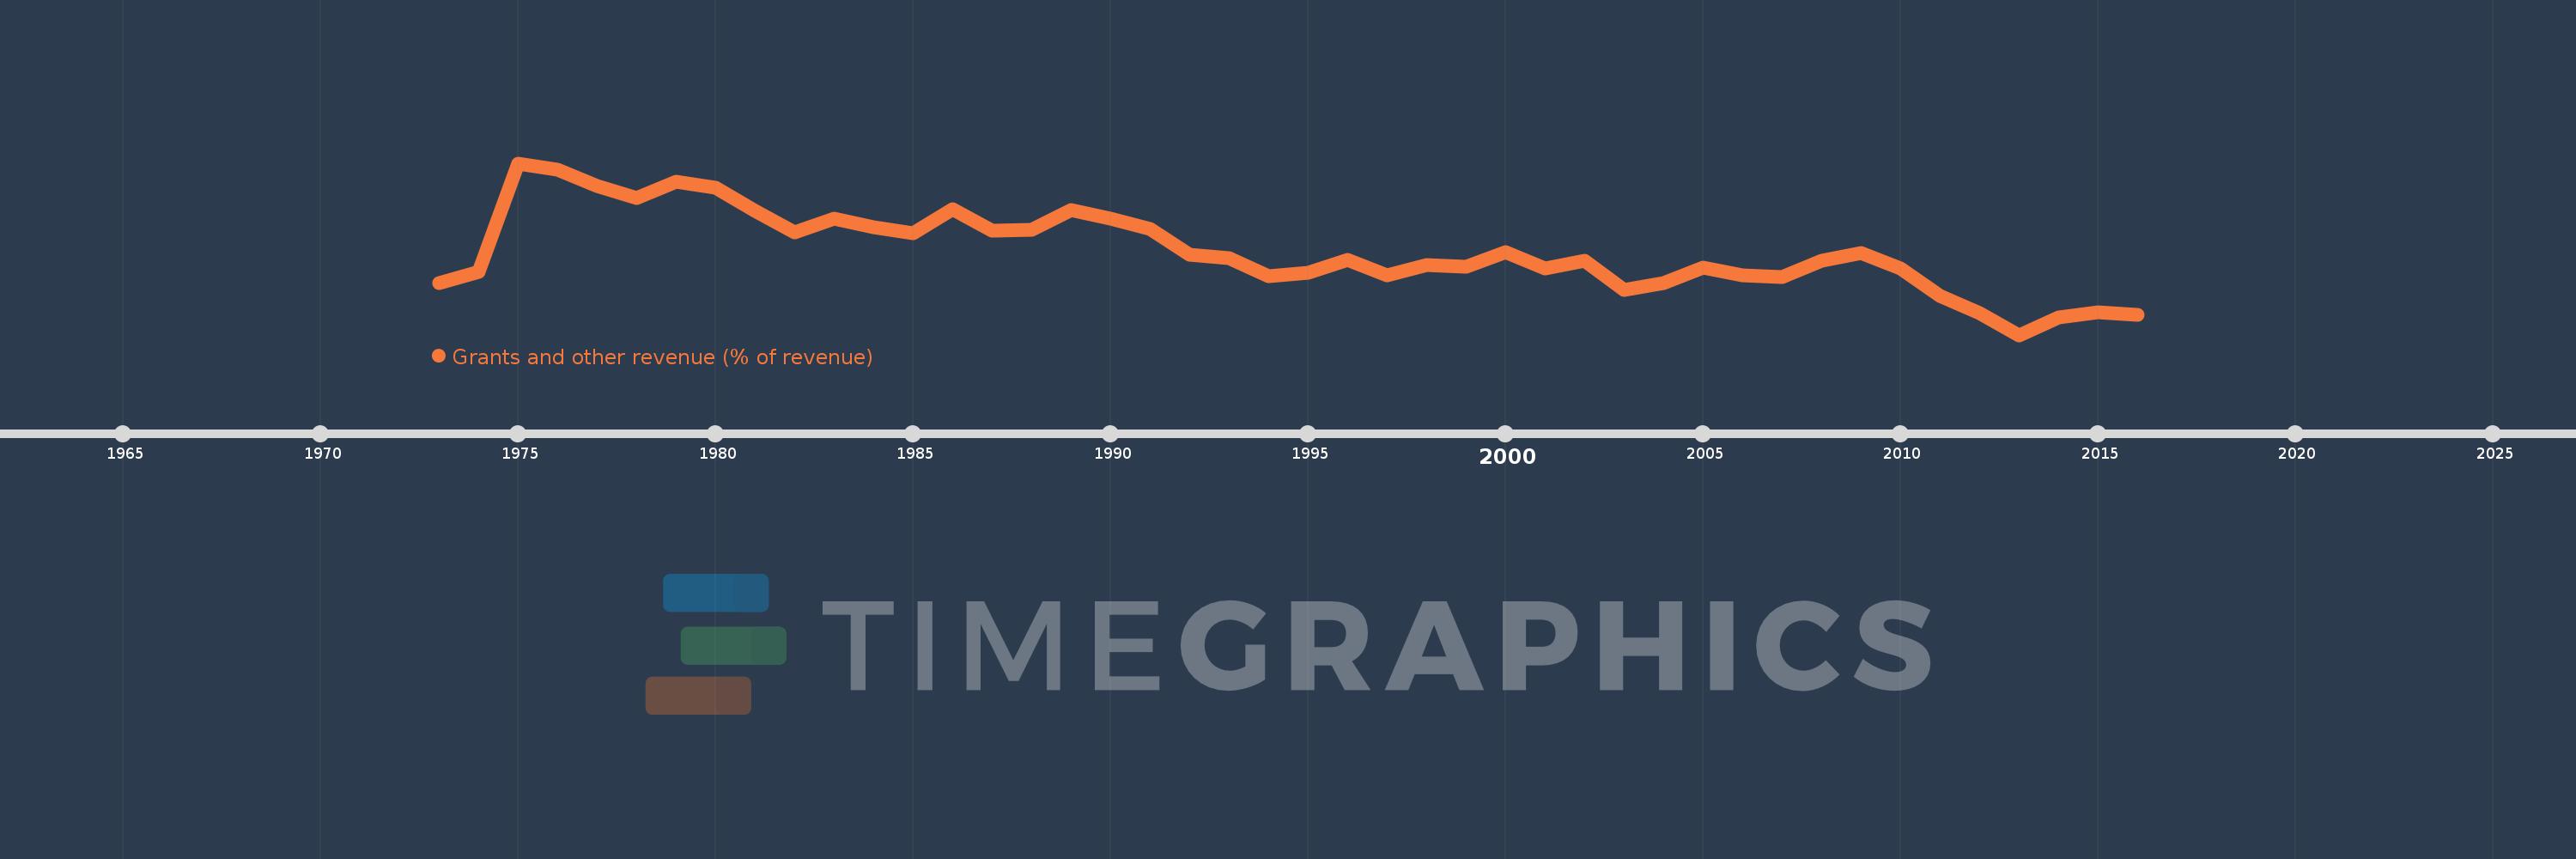
Grants and other revenue (% of revenue)
2016,2015,2014,2013,2012,2011,2010,2009,2008,2007,2006,2005,2004,2003,2002,2001,2000,1999,1998,1997,1996,1995,1994,1993,1992,1991,1990,1989,1988,1987,1986,1985,1984,1983,1982,1981,1980,1979,1978,1977,1976,1975,1974,1973
Cette statistique dans les autres pays:
AfghanistanAlbaniaAlgeriaAngolaAntigua and BarbudaArab WorldArgentinaArmeniaAustraliaAustriaAzerbaijanBahamas, TheBahrainBangladeshBarbadosBelarusBelgiumBelizeBeninBhutanBoliviaBosnia and HerzegovinaBotswanaBrazilBulgariaBurkina FasoBurundiCabo VerdeCambodiaCanadaCaribbean small statesCentral African RepublicCentral Europe and the BalticsChileChinaColombiaCongo, Dem. Rep.Congo, Rep.Costa RicaCote d'IvoireCroatiaCyprusCzech RepublicDenmarkDominicaDominican RepublicEarly-demographic dividendEast Asia & PacificEast Asia & Pacific (excluding high income)East Asia & Pacific (IDA & IBRD countries)Egypt, Arab Rep.El SalvadorEquatorial GuineaEstoniaEthiopiaEuro areaEurope & Central AsiaEurope & Central Asia (excluding high income)Europe & Central Asia (IDA & IBRD countries)European UnionFijiFinlandFranceGambia, TheGeorgiaGermanyGhanaGreeceGrenadaGuatemalaHeavily indebted poor countries (HIPC)High incomeHondurasHong Kong SAR, ChinaHungaryIBRD onlyIcelandIDA & IBRD totalIDA blendIDA onlyIDA totalIndiaIndonesiaIran, Islamic Rep.IraqIrelandIsraelItalyJamaicaJapanJordanKazakhstanKenyaKiribatiKorea, Rep.KuwaitKyrgyz RepublicLao PDRLate-demographic dividendLatin America & Caribbean Latin America & Caribbean (excluding high income)Latin America & the Caribbean (IDA & IBRD countries)LatviaLeast developed countries: UN classificationLebanonLesothoLiberiaLithuaniaLow & middle incomeLow incomeLower middle incomeLuxembourgMacao SAR, ChinaMacedonia, FYRMadagascarMalawiMalaysiaMaldivesMaliMaltaMauritiusMexicoMicronesia, Fed. Sts.Middle East & North AfricaMiddle East & North Africa (excluding high income)Middle East & North Africa (IDA & IBRD countries)Middle incomeMoldovaMongoliaMoroccoMozambiqueMyanmarNamibiaNepalNetherlandsNew ZealandNicaraguaNigeriaNorth AmericaNorwayOECD membersOmanOther small statesPakistanPanamaPapua New GuineaParaguayPeruPhilippinesPolandPortugalPost-demographic dividendPre-demographic dividendQatarRomaniaRussian FederationRwandaSamoaSan MarinoSao Tome and PrincipeSenegalSerbiaSeychellesSierra LeoneSingaporeSlovak RepublicSloveniaSmall statesSolomon IslandsSouth AfricaSouth AsiaSouth Asia (IDA & IBRD)SpainSri LankaSt. Kitts and NevisSt. LuciaSt. Vincent and the GrenadinesSub-Saharan Africa Sub-Saharan Africa (excluding high income)Sub-Saharan Africa (IDA & IBRD countries)SurinameSwazilandSwedenSwitzerlandSyrian Arab RepublicTajikistanTanzaniaThailandTimor-LesteTogoTrinidad and TobagoTunisiaTurkeyUgandaUkraineUnited Arab EmiratesUnited KingdomUnited StatesUpper middle incomeUruguayVanuatuVenezuela, RBVietnamWest Bank and GazaWorldYemen, Rep.ZambiaZimbabwe La ligne de temps
Cette échelle de temps montre un graphique de 1973 année à 2016 année Chile. Les données jusqu'à 1972 année ne sont pas présentés. Quantité d'observations actuelles selon dates: 44.
Source (désignation):
Les indicateurs du développement mondiale
Source (organisation):
International Monetary Fund, Government Finance Statistics Yearbook and data files.
Catégories:
Public Sector
Dernière mise à jour
23 avr. 2017
Les indicateurs de changement de valeurs selon les années
Minimum:
7.831
1 janv. 2013
Maximum:
29.183
1 janv. 1975
Pour la date d''observation
Valeur
Changement absolu
Le changement par rapport à la valeur précédente
1 janv. 1973
14.286
+14.286
0.0%
1 janv. 1974
15.625
+1.339
9.37%
1 janv. 1975
29.183
+13.558
86.77%
1 janv. 1976
28.363
-0.82
-2.81%
1 janv. 1977
26.356
-2.007
-7.08%
1 janv. 1978
24.863
-1.493
-5.67%
1 janv. 1979
26.918
+2.055
8.27%
1 janv. 1980
26.13
-0.788
-2.93%
1 janv. 1981
23.229
-2.901
-11.1%
1 janv. 1982
20.632
-2.597
-11.18%
1 janv. 1983
22.343
+1.711
8.29%
1 janv. 1984
21.233
-1.11
-4.97%
1 janv. 1985
20.494
-0.739
-3.48%
1 janv. 1986
23.459
+2.965
14.47%
1 janv. 1987
20.823
-2.636
-11.24%
1 janv. 1988
20.907
+0.085
0.41%
1 janv. 1989
23.411
+2.503
11.97%
1 janv. 1990
22.278
-1.133
-4.84%
1 janv. 1991
21.016
-1.262
-5.67%
1 janv. 1992
17.788
-3.227
-15.36%
1 janv. 1993
17.354
-0.435
-2.44%
1 janv. 1994
15.146
-2.208
-12.72%
1 janv. 1995
15.579
+0.433
2.86%
1 janv. 1996
17.138
+1.559
10.01%
1 janv. 1997
15.286
-1.852
-10.81%
1 janv. 1998
16.526
+1.24
8.11%
1 janv. 1999
16.328
-0.198
-1.2%
1 janv. 2000
18.081
+1.753
10.74%
1 janv. 2001
16.138
-1.943
-10.75%
1 janv. 2002
17.029
+0.891
5.52%
1 janv. 2003
13.415
-3.615
-21.23%
1 janv. 2004
14.33
+0.915
6.82%
1 janv. 2005
16.255
+1.926
13.44%
1 janv. 2006
15.292
-0.964
-5.93%
1 janv. 2007
15.009
-0.283
-1.85%
1 janv. 2008
17.045
+2.036
13.57%
1 janv. 2009
18.034
+0.989
5.8%
1 janv. 2010
16.135
-1.899
-10.53%
1 janv. 2011
12.696
-3.44
-21.32%
1 janv. 2012
10.558
-2.138
-16.84%
1 janv. 2013
7.831
-2.727
-25.83%
1 janv. 2014
10.035
+2.204
28.15%
1 janv. 2015
10.61
+0.576
5.74%
1 janv. 2016
10.325
-0.285
-2.69%
Classement des pays selon les statistiques actuelles par années


Commentaires: