29
/fr/
fr
AIzaSyAYiBZKx7MnpbEhh9jyipgxe19OcubqV5w
April 1, 2024
52544
OECD members
OED
false
2
1
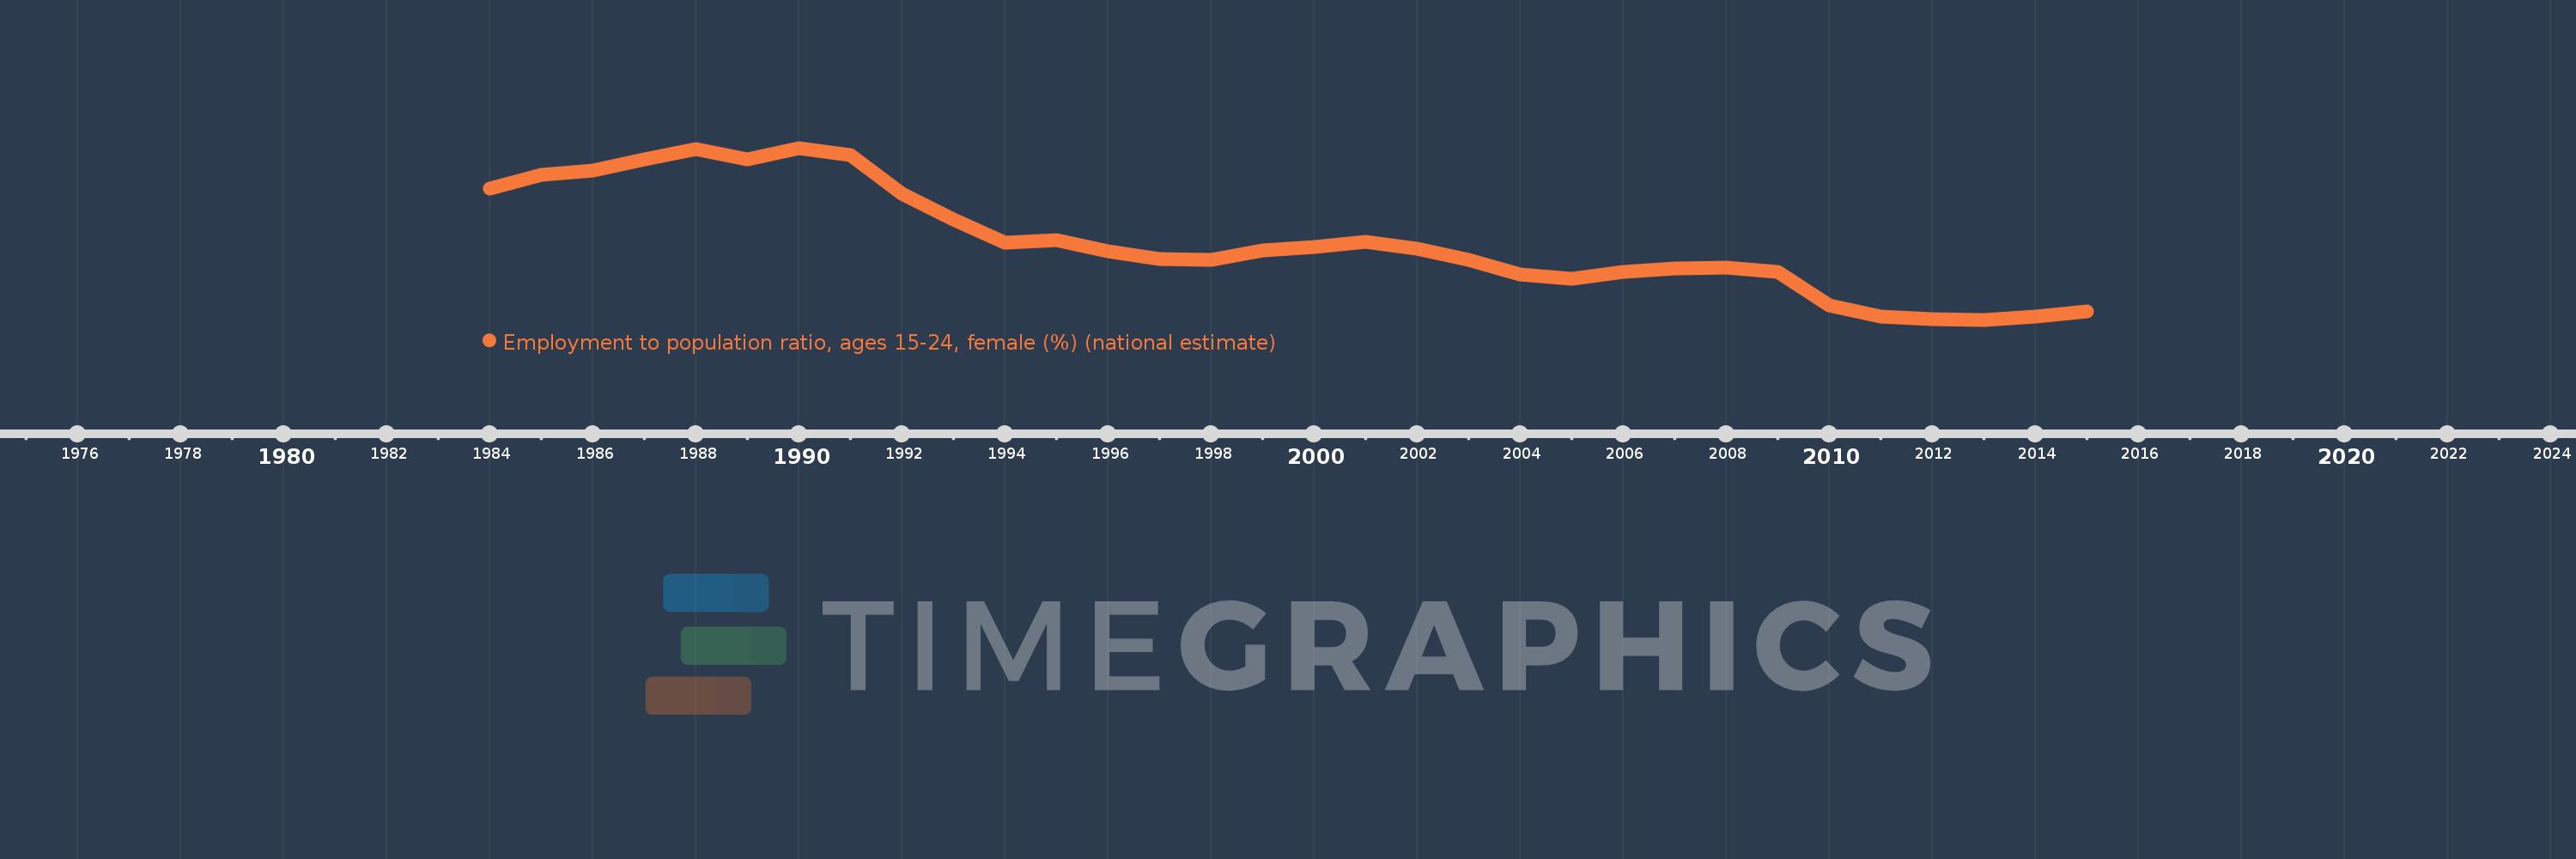
Employment to population ratio, ages 15-24, female (%) (national estimate)
2015,2014,2013,2012,2011,2010,2009,2008,2007,2006,2005,2004,2003,2002,2001,2000,1999,1998,1997,1996,1995,1994,1993,1992,1991,1990,1989,1988,1987,1986,1985,1984
Cette statistique dans les autres pays:
La ligne de temps
Cette échelle de temps montre un graphique de 1984 année à 2015 année OECD members. Les données jusqu'à 1983 année ne sont pas présentés. Quantité d'observations actuelles selon dates: 32.
Source (désignation):
Les indicateurs du développement mondiale
Source (organisation):
International Labour Organization, Key Indicators of the Labour Market database.
Catégories:
Social Protection & Labor
Dernière mise à jour
23 avr. 2017
Les indicateurs de changement de valeurs selon les années
Minimum:
36.164
1 janv. 2013
Maximum:
46.516
1 janv. 1990
Pour la date d''observation
Valeur
Changement absolu
Le changement par rapport à la valeur précédente
1 janv. 1984
44.061
+44.061
0.0%
1 janv. 1985
44.917
+0.856
1.94%
1 janv. 1986
45.145
+0.228
0.51%
1 janv. 1987
45.837
+0.692
1.53%
1 janv. 1988
46.453
+0.617
1.34%
1 janv. 1989
45.835
-0.619
-1.33%
1 janv. 1990
46.516
+0.682
1.49%
1 janv. 1991
46.102
-0.414
-0.89%
1 janv. 1992
43.74
-2.362
-5.12%
1 janv. 1993
42.198
-1.542
-3.53%
1 janv. 1994
40.811
-1.387
-3.29%
1 janv. 1995
40.955
+0.145
0.35%
1 janv. 1996
40.314
-0.642
-1.57%
1 janv. 1997
39.805
-0.509
-1.26%
1 janv. 1998
39.766
-0.039
-0.1%
1 janv. 1999
40.358
+0.593
1.49%
1 janv. 2000
40.53
+0.172
0.43%
1 janv. 2001
40.858
+0.328
0.81%
1 janv. 2002
40.445
-0.413
-1.01%
1 janv. 2003
39.762
-0.683
-1.69%
1 janv. 2004
38.885
-0.878
-2.21%
1 janv. 2005
38.616
-0.269
-0.69%
1 janv. 2006
39.046
+0.43
1.11%
1 janv. 2007
39.255
+0.21
0.54%
1 janv. 2008
39.331
+0.076
0.19%
1 janv. 2009
39.058
-0.273
-0.69%
1 janv. 2010
37.052
-2.006
-5.14%
1 janv. 2011
36.351
-0.701
-1.89%
1 janv. 2012
36.215
-0.136
-0.37%
1 janv. 2013
36.164
-0.051
-0.14%
1 janv. 2014
36.358
+0.194
0.54%
1 janv. 2015
36.678
+0.32
0.88%
Classement des pays selon les statistiques actuelles par années


Commentaires: