29
/fr/
fr
AIzaSyAYiBZKx7MnpbEhh9jyipgxe19OcubqV5w
April 1, 2024
33366
European Union
EUU
false
2
1
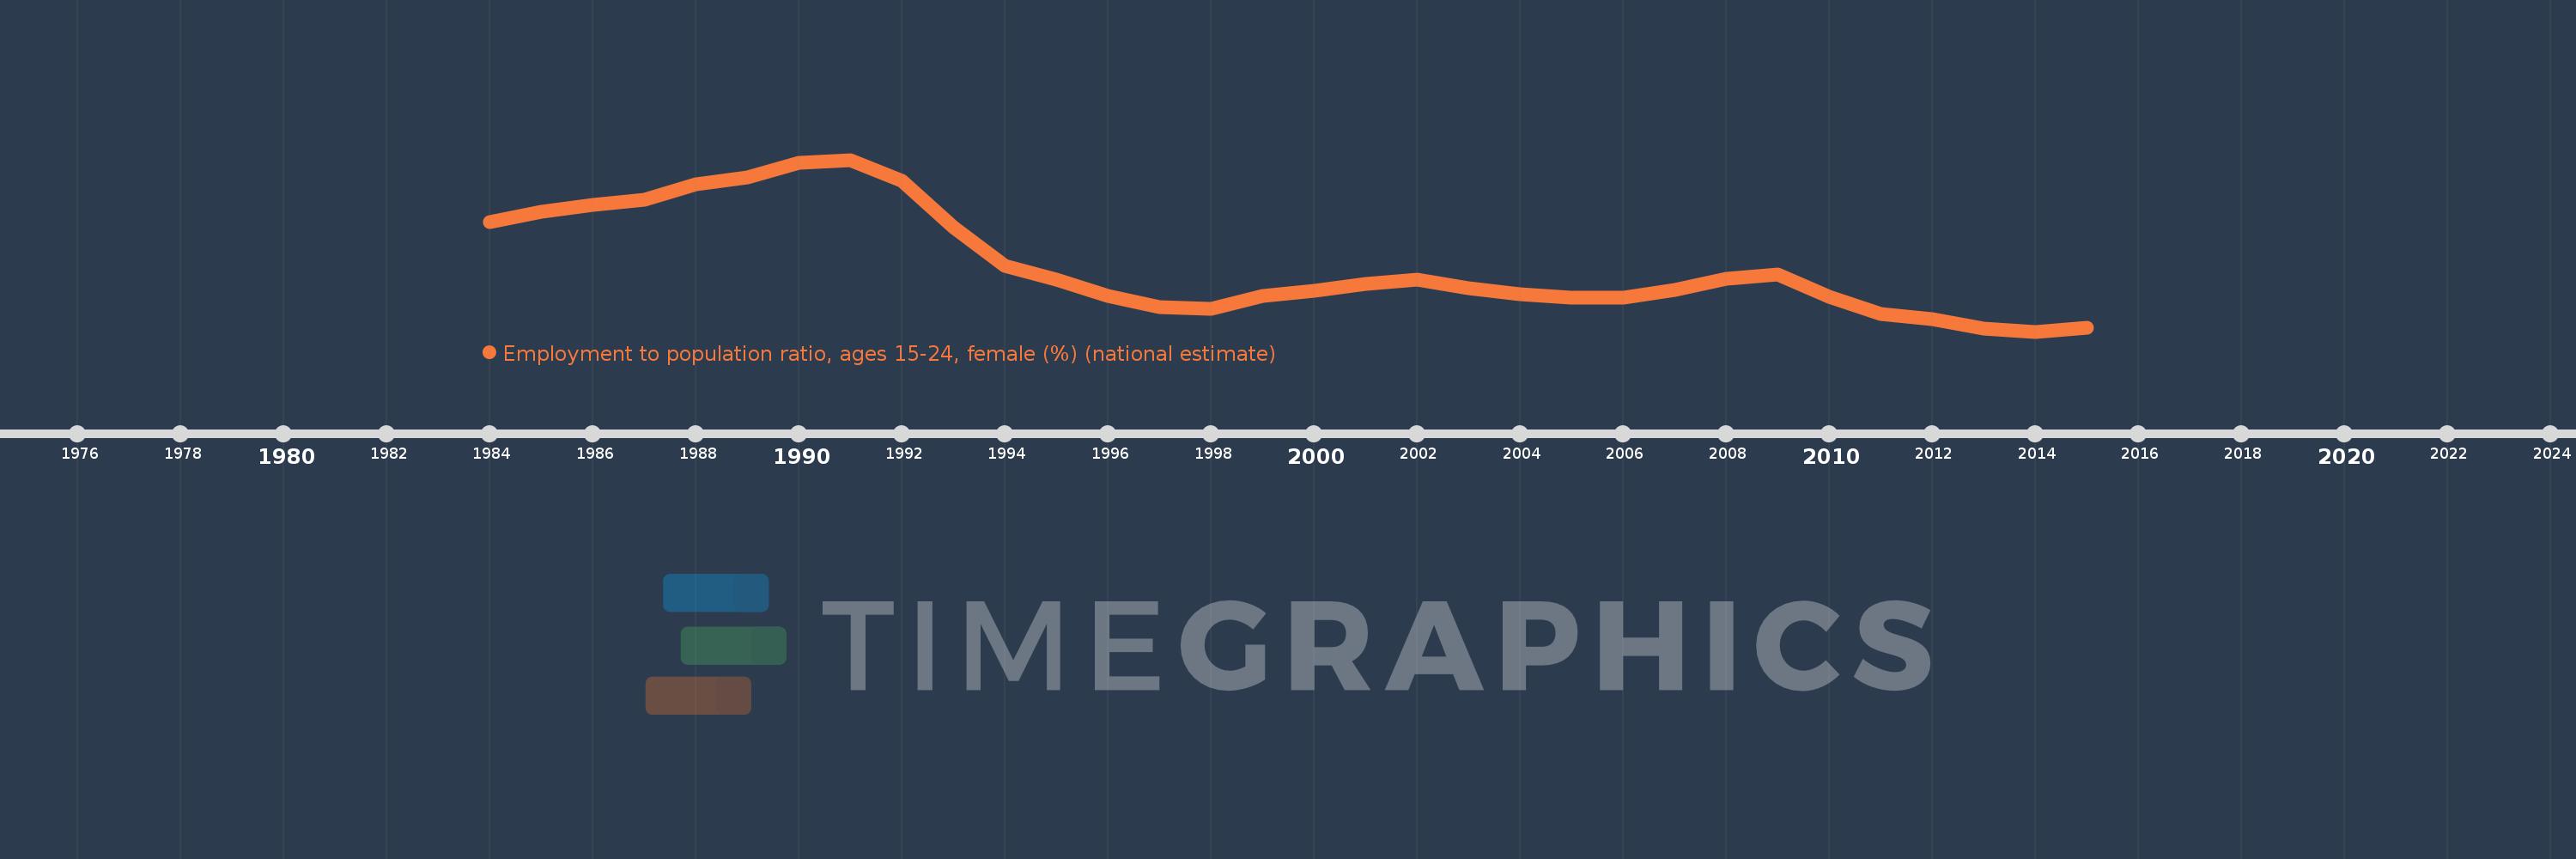
Employment to population ratio, ages 15-24, female (%) (national estimate)
2015,2014,2013,2012,2011,2010,2009,2008,2007,2006,2005,2004,2003,2002,2001,2000,1999,1998,1997,1996,1995,1994,1993,1992,1991,1990,1989,1988,1987,1986,1985,1984
Cette statistique dans les autres pays:
La ligne de temps
Cette échelle de temps montre un graphique de 1984 année à 2015 année European Union. Les données jusqu'à 1983 année ne sont pas présentés. Quantité d'observations actuelles selon dates: 32.
Source (désignation):
Les indicateurs du développement mondiale
Source (organisation):
International Labour Organization, Key Indicators of the Labour Market database.
Catégories:
Social Protection & Labor
Dernière mise à jour
23 avr. 2017
Les indicateurs de changement de valeurs selon les années
Minimum:
30.531
1 janv. 2014
Maximum:
42.377
1 janv. 1991
Pour la date d''observation
Valeur
Changement absolu
Le changement par rapport à la valeur précédente
1 janv. 1984
38.063
+38.063
0.0%
1 janv. 1985
38.805
+0.742
1.95%
1 janv. 1986
39.286
+0.481
1.24%
1 janv. 1987
39.614
+0.328
0.84%
1 janv. 1988
40.68
+1.066
2.69%
1 janv. 1989
41.166
+0.486
1.19%
1 janv. 1990
42.185
+1.019
2.48%
1 janv. 1991
42.377
+0.191
0.45%
1 janv. 1992
40.937
-1.44
-3.4%
1 janv. 1993
37.734
-3.203
-7.82%
1 janv. 1994
35.046
-2.688
-7.12%
1 janv. 1995
34.094
-0.952
-2.72%
1 janv. 1996
32.987
-1.107
-3.25%
1 janv. 1997
32.194
-0.793
-2.4%
1 janv. 1998
32.082
-0.111
-0.35%
1 janv. 1999
32.973
+0.891
2.78%
1 janv. 2000
33.353
+0.379
1.15%
1 janv. 2001
33.837
+0.484
1.45%
1 janv. 2002
34.099
+0.262
0.78%
1 janv. 2003
33.511
-0.588
-1.73%
1 janv. 2004
33.12
-0.391
-1.17%
1 janv. 2005
32.842
-0.277
-0.84%
1 janv. 2006
32.855
+0.013
0.04%
1 janv. 2007
33.387
+0.532
1.62%
1 janv. 2008
34.181
+0.794
2.38%
1 janv. 2009
34.472
+0.292
0.85%
1 janv. 2010
32.928
-1.544
-4.48%
1 janv. 2011
31.772
-1.156
-3.51%
1 janv. 2012
31.403
-0.369
-1.16%
1 janv. 2013
30.746
-0.657
-2.09%
1 janv. 2014
30.531
-0.215
-0.7%
1 janv. 2015
30.8
+0.27
0.88%
Classement des pays selon les statistiques actuelles par années


Commentaires: