29
/fr/
fr
AIzaSyAYiBZKx7MnpbEhh9jyipgxe19OcubqV5w
April 1, 2024
29793
Euro area
EMU
false
2
1
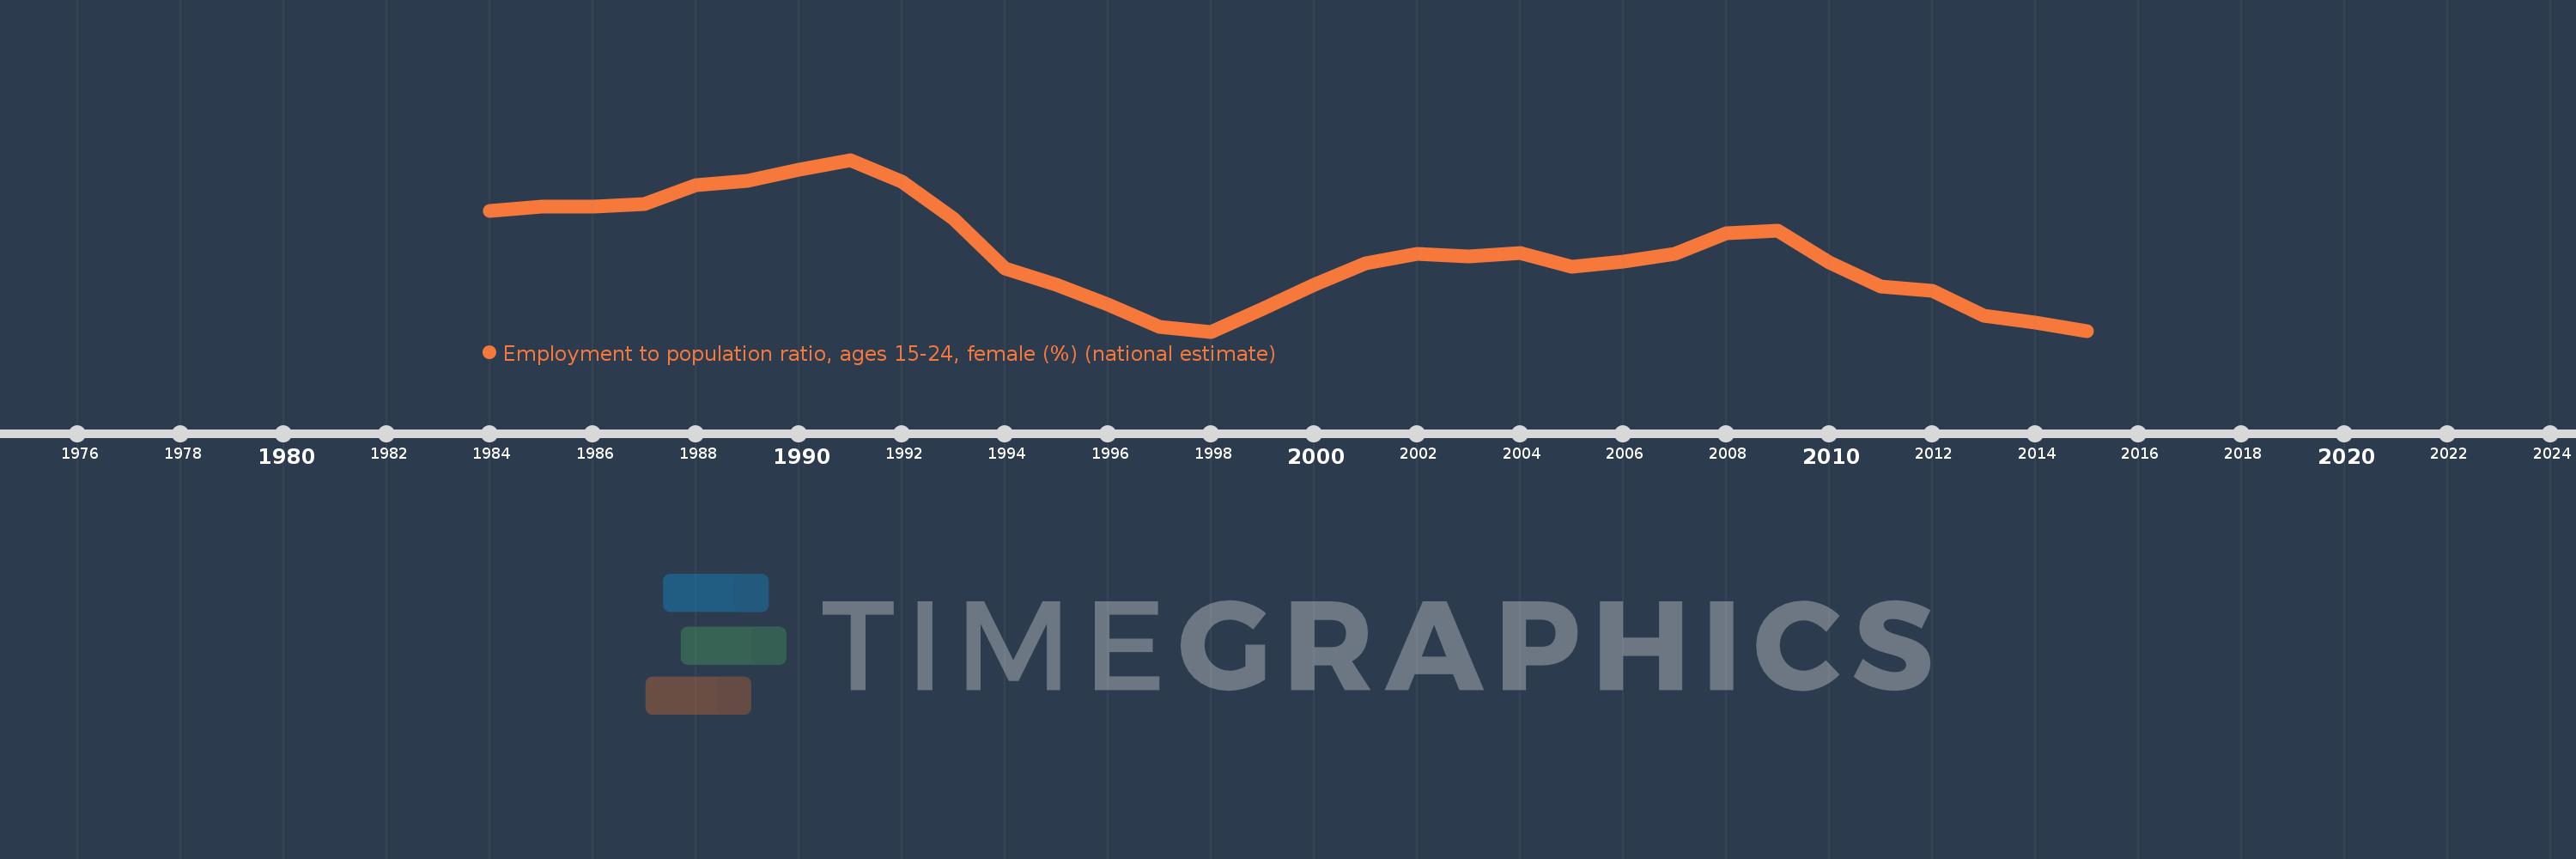
Employment to population ratio, ages 15-24, female (%) (national estimate)
2015,2014,2013,2012,2011,2010,2009,2008,2007,2006,2005,2004,2003,2002,2001,2000,1999,1998,1997,1996,1995,1994,1993,1992,1991,1990,1989,1988,1987,1986,1985,1984
Cette statistique dans les autres pays:
La ligne de temps
Cette échelle de temps montre un graphique de 1984 année à 2015 année Euro area. Les données jusqu'à 1983 année ne sont pas présentés. Quantité d'observations actuelles selon dates: 32.
Source (désignation):
Les indicateurs du développement mondiale
Source (organisation):
International Labour Organization, Key Indicators of the Labour Market database.
Catégories:
Social Protection & Labor
Dernière mise à jour
23 avr. 2017
Les indicateurs de changement de valeurs selon les années
Minimum:
29.016
1 janv. 1998
Maximum:
37.859
1 janv. 1991
Pour la date d''observation
Valeur
Changement absolu
Le changement par rapport à la valeur précédente
1 janv. 1984
35.246
+35.246
0.0%
1 janv. 1985
35.431
+0.185
0.53%
1 janv. 1986
35.462
+0.03
0.09%
1 janv. 1987
35.604
+0.143
0.4%
1 janv. 1988
36.551
+0.947
2.66%
1 janv. 1989
36.762
+0.21
0.58%
1 janv. 1990
37.337
+0.576
1.57%
1 janv. 1991
37.859
+0.521
1.4%
1 janv. 1992
36.741
-1.117
-2.95%
1 janv. 1993
34.849
-1.892
-5.15%
1 janv. 1994
32.256
-2.593
-7.44%
1 janv. 1995
31.426
-0.83
-2.57%
1 janv. 1996
30.405
-1.021
-3.25%
1 janv. 1997
29.241
-1.165
-3.83%
1 janv. 1998
29.016
-0.225
-0.77%
1 janv. 1999
30.191
+1.175
4.05%
1 janv. 2000
31.438
+1.247
4.13%
1 janv. 2001
32.545
+1.107
3.52%
1 janv. 2002
33.017
+0.471
1.45%
1 janv. 2003
32.896
-0.121
-0.37%
1 janv. 2004
33.074
+0.178
0.54%
1 janv. 2005
32.376
-0.698
-2.11%
1 janv. 2006
32.617
+0.241
0.75%
1 janv. 2007
33.024
+0.407
1.25%
1 janv. 2008
34.07
+1.047
3.17%
1 janv. 2009
34.218
+0.147
0.43%
1 janv. 2010
32.58
-1.638
-4.79%
1 janv. 2011
31.337
-1.243
-3.82%
1 janv. 2012
31.138
-0.199
-0.64%
1 janv. 2013
29.847
-1.291
-4.15%
1 janv. 2014
29.465
-0.382
-1.28%
1 janv. 2015
29.052
-0.413
-1.4%
Classement des pays selon les statistiques actuelles par années


Commentaires: