29
/fr/
fr
AIzaSyAYiBZKx7MnpbEhh9jyipgxe19OcubqV5w
April 1, 2024
43660
Latin America & the Caribbean (IDA & IBRD countries)
TLA
false
2
1
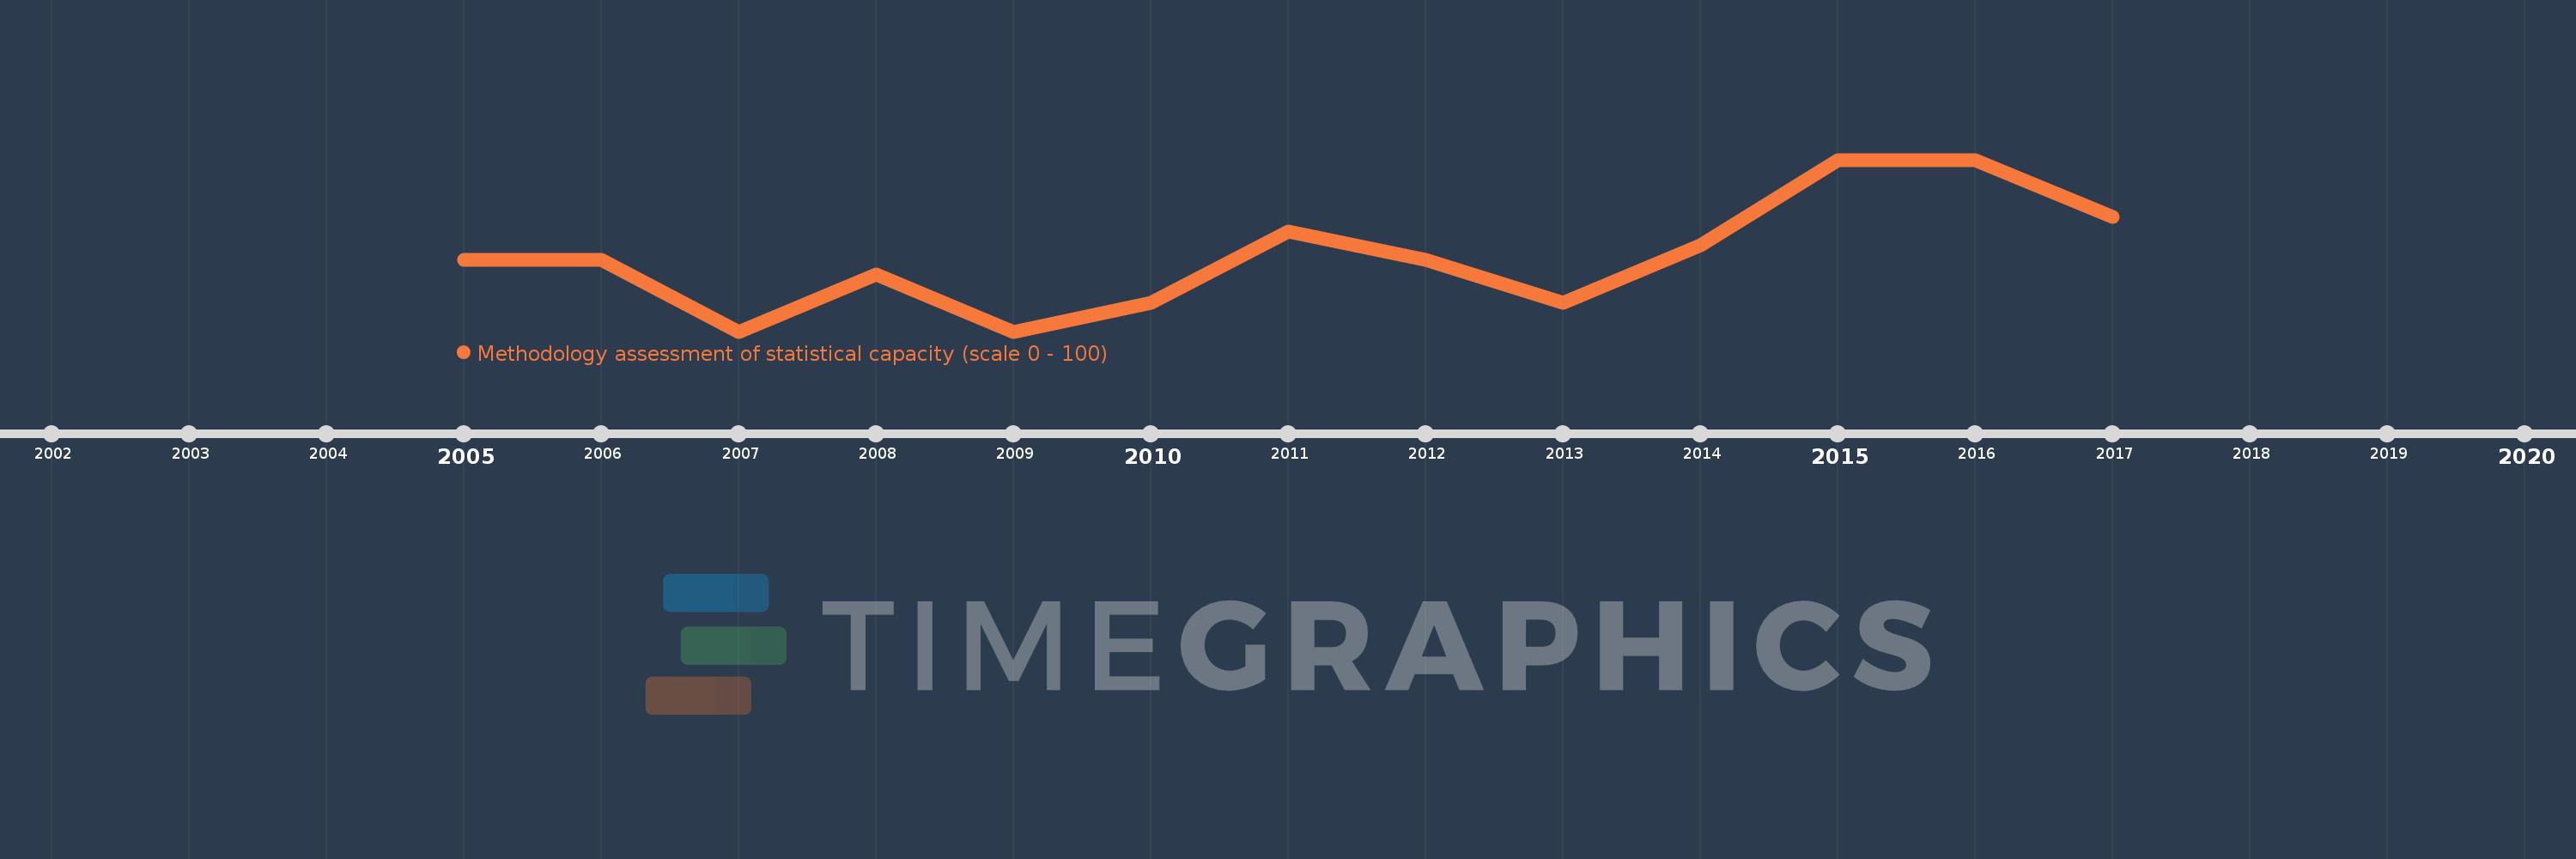
Methodology assessment of statistical capacity (scale 0 - 100)
2017,2016,2015,2014,2013,2012,2011,2010,2009,2008,2007,2006,2005
Cette statistique dans les autres pays:
La ligne de temps
Cette échelle de temps montre un graphique de 2005 année à 2017 année Latin America & the Caribbean (IDA & IBRD countries). Les données jusqu'à 2004 année ne sont pas présentés. Quantité d'observations actuelles selon dates: 13.
Source (désignation):
Les indicateurs du développement mondiale
Source (organisation):
World Bank
Catégories:
Public Sector
Dernière mise à jour
23 avr. 2017
Les indicateurs de changement de valeurs selon les années
Minimum:
66.19
1 janv. 2007
Maximum:
71.905
1 janv. 2015
Pour la date d''observation
Valeur
Changement absolu
Le changement par rapport à la valeur précédente
1 janv. 2005
68.571
+68.571
0.0%
1 janv. 2006
68.571
0.0
0.0%
1 janv. 2007
66.19
-2.381
-3.47%
1 janv. 2008
68.095
+1.905
2.88%
1 janv. 2009
66.19
-1.905
-2.8%
1 janv. 2010
67.143
+0.952
1.44%
1 janv. 2011
69.524
+2.381
3.55%
1 janv. 2012
68.571
-0.952
-1.37%
1 janv. 2013
67.143
-1.429
-2.08%
1 janv. 2014
69.048
+1.905
2.84%
1 janv. 2015
71.905
+2.857
4.14%
1 janv. 2016
71.905
0.0
0.0%
1 janv. 2017
70.0
-1.905
-2.65%
Classement des pays selon les statistiques actuelles par années


Commentaires: