29
/es/
es
AIzaSyAYiBZKx7MnpbEhh9jyipgxe19OcubqV5w
April 1, 2024
43660
Latin America & the Caribbean (IDA & IBRD countries)
TLA
false
2
1
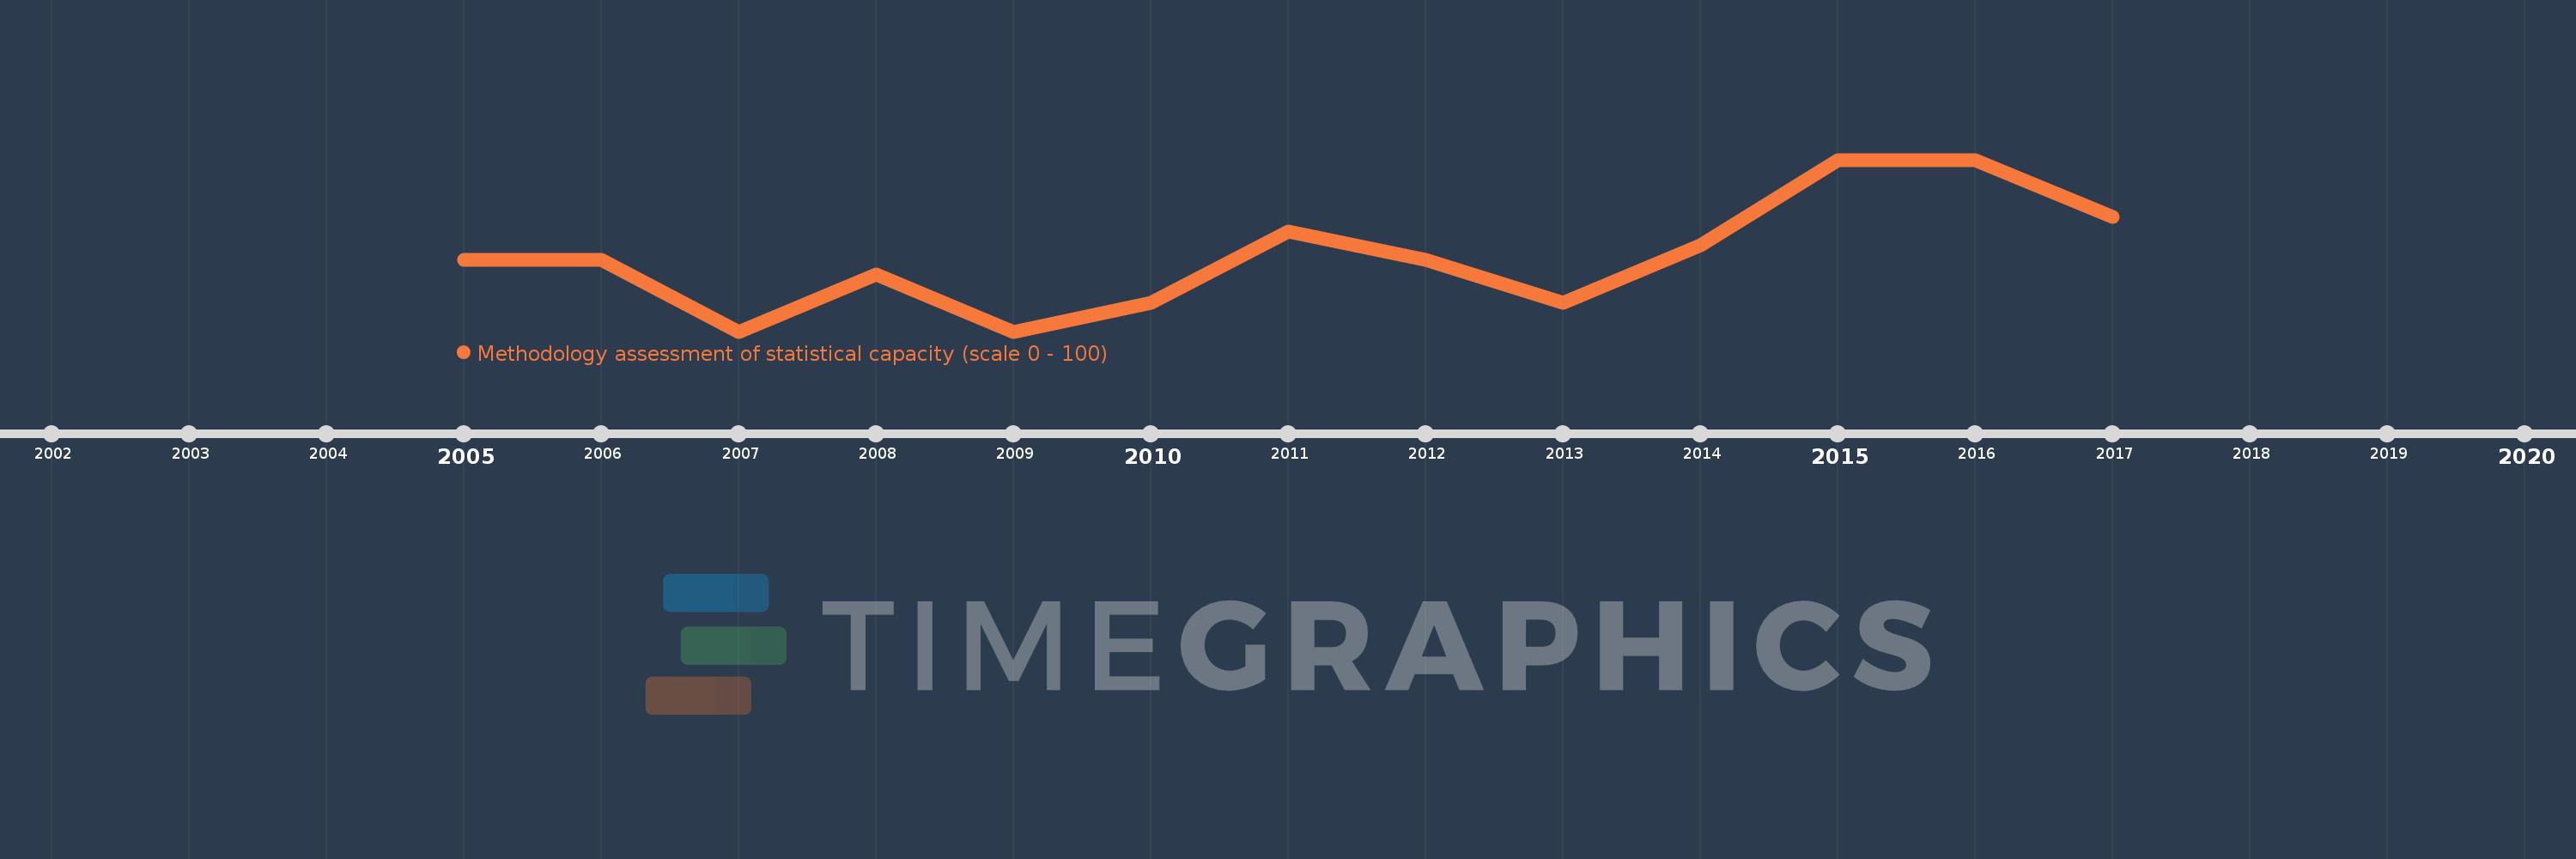
Methodology assessment of statistical capacity (scale 0 - 100)
2017,2016,2015,2014,2013,2012,2011,2010,2009,2008,2007,2006,2005
Estas estadísticas en otros países:
línea de tiempo (timeline):
En esta escala de tiempo se presenta un gráfico de 2005 y 2017 de Latin America & the Caribbean (IDA & IBRD countries). Los datos de 2004 están ausentes. El número de observaciones reales por fecha: 13.
Fuente (nombre):
Indicadores del desarrollo mundial
Fuente (organización):
World Bank
Categorías:
Public Sector
Se ha actualizado:
23 abr 2017 año
Los indicadores de los cambios de valor en los últimos años
Mínimo:
66.19
1 ene 2007 año
Máximo:
71.905
1 ene 2015 año
A la fecha de observación
Valor
Cambio absoluto
El cambio con respecto al valor anterior
1 ene 2005 año
68.571
+68.571
0.0%
1 ene 2006 año
68.571
0.0
0.0%
1 ene 2007 año
66.19
-2.381
-3.47%
1 ene 2008 año
68.095
+1.905
2.88%
1 ene 2009 año
66.19
-1.905
-2.8%
1 ene 2010 año
67.143
+0.952
1.44%
1 ene 2011 año
69.524
+2.381
3.55%
1 ene 2012 año
68.571
-0.952
-1.37%
1 ene 2013 año
67.143
-1.429
-2.08%
1 ene 2014 año
69.048
+1.905
2.84%
1 ene 2015 año
71.905
+2.857
4.14%
1 ene 2016 año
71.905
0.0
0.0%
1 ene 2017 año
70.0
-1.905
-2.65%
Ranking de los países por los datos estadísticos actuales


Comentarios: