29
/fr/
fr
AIzaSyAYiBZKx7MnpbEhh9jyipgxe19OcubqV5w
April 1, 2024
42539
Latin America & Caribbean (excluding high income)
LAC
false
2
1
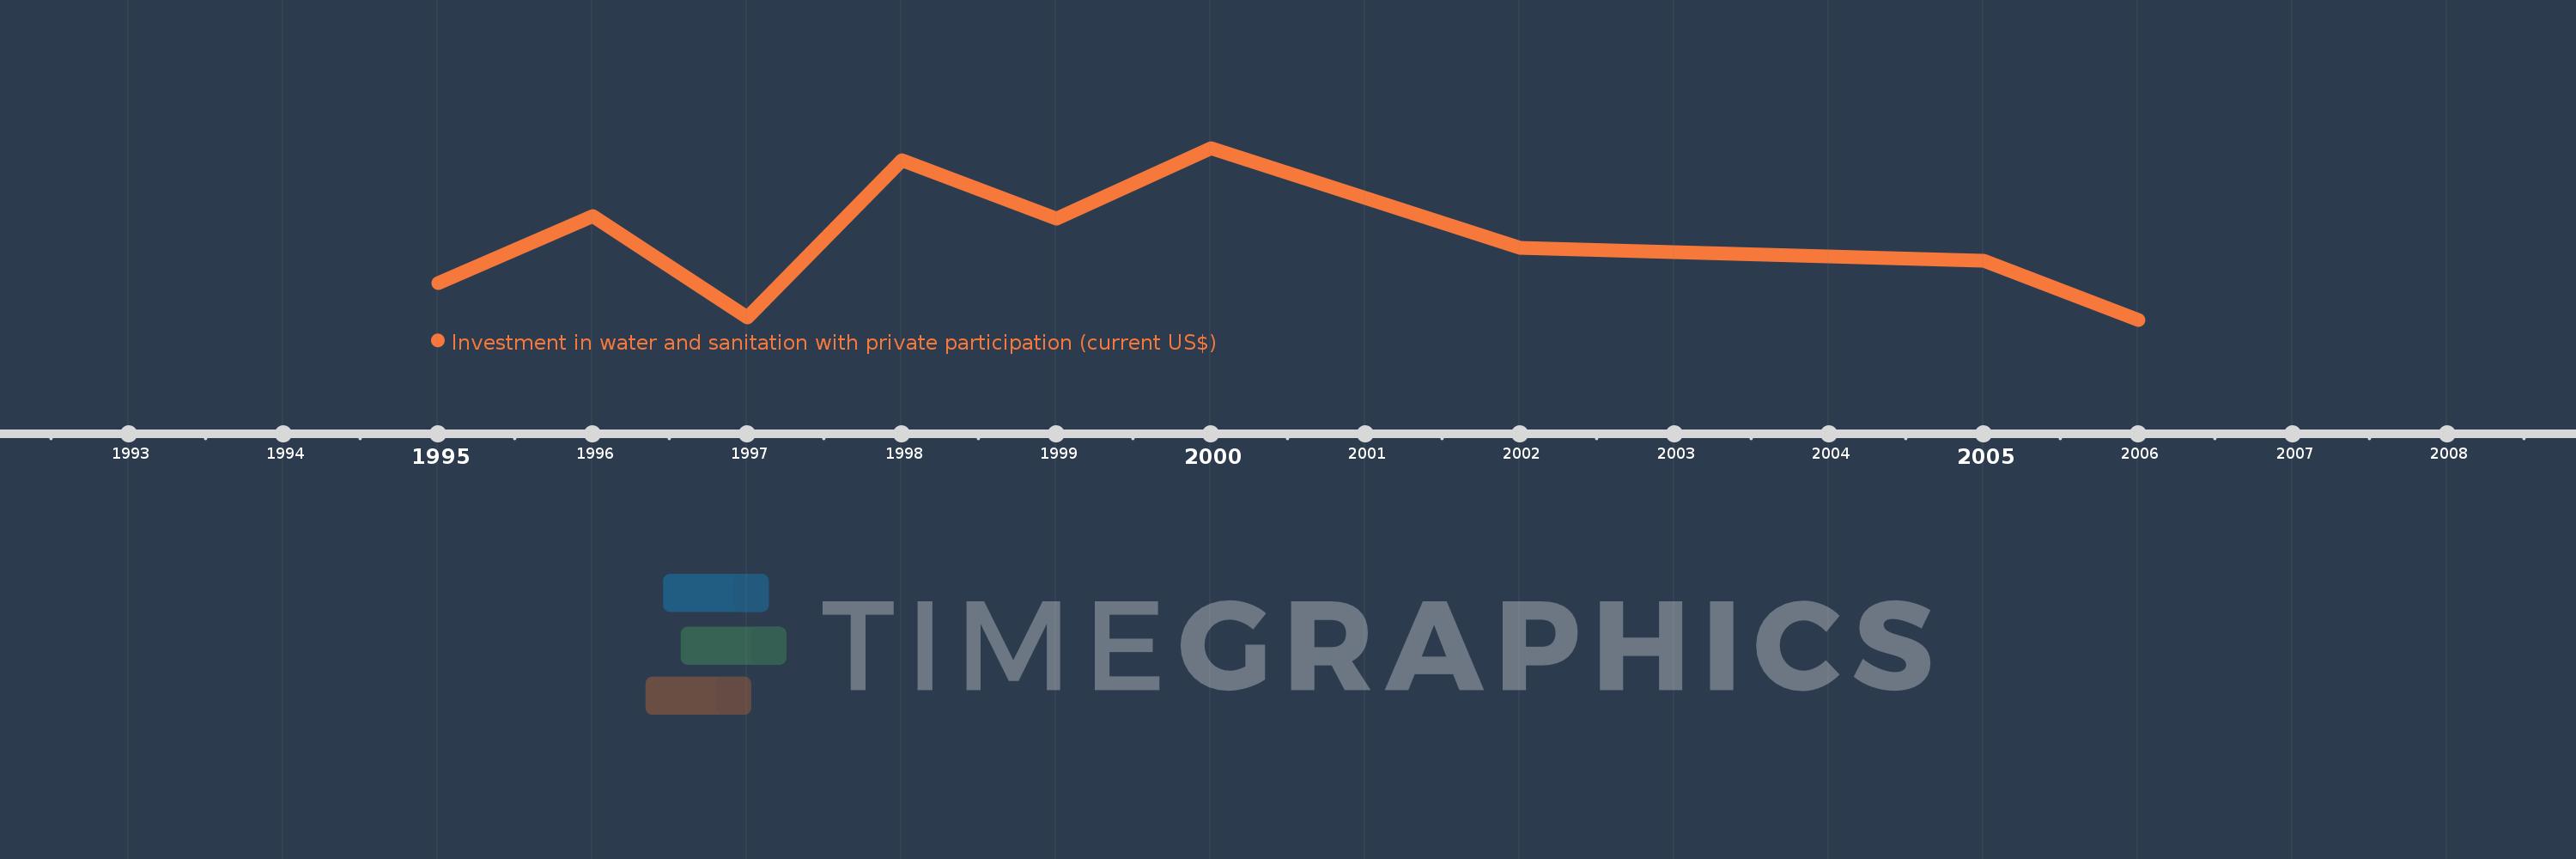
Investment in water and sanitation with private participation (current US$)
2006,2005,2002,2000,1999,1998,1997,1996,1995
Cette statistique dans les autres pays:
La ligne de temps
Cette échelle de temps montre un graphique de 1995 année à 2006 année Latin America & Caribbean (excluding high income). Les données jusqu'à 1994 année ne sont pas présentés. Quantité d'observations actuelles selon dates: 9.
Source (désignation):
Les indicateurs du développement mondiale
Source (organisation):
World Bank, Private Participation in Infrastructure Project Database (http://ppi.worldbank.org).
Catégories:
Infrastructure, Private Sector
Dernière mise à jour
23 avr. 2017
Les indicateurs de changement de valeurs selon les années
Minimum:
120.444 mln.
1 janv. 2006
Maximum:
2.007 mds
1 janv. 2000
Pour la date d''observation
Valeur
Changement absolu
Le changement par rapport à la valeur précédente
1 janv. 1995
525.2 mln.
+525.2 mln.
0.0%
1 janv. 1996
1.264 mds
+738.6 mln.
140.63%
1 janv. 1997
147.9 mln.
-1.116 mds
-88.3%
1 janv. 1998
1.869 mds
+1.721 mds
1.16 milles%
1 janv. 1999
1.227 mds
-642.3 mln.
-34.36%
1 janv. 2000
2.007 mds
+780.4 mln.
63.61%
1 janv. 2002
906.43 mln.
-1.101 mds
-54.84%
1 janv. 2005
772.68 mln.
-133.75 mln.
-14.76%
1 janv. 2006
120.444 mln.
-652.236 mln.
-84.41%
Classement des pays selon les statistiques actuelles par années


Commentaires: