29
/fr/
fr
AIzaSyAYiBZKx7MnpbEhh9jyipgxe19OcubqV5w
April 1, 2024
262447
Thailand
THA
true
2
1
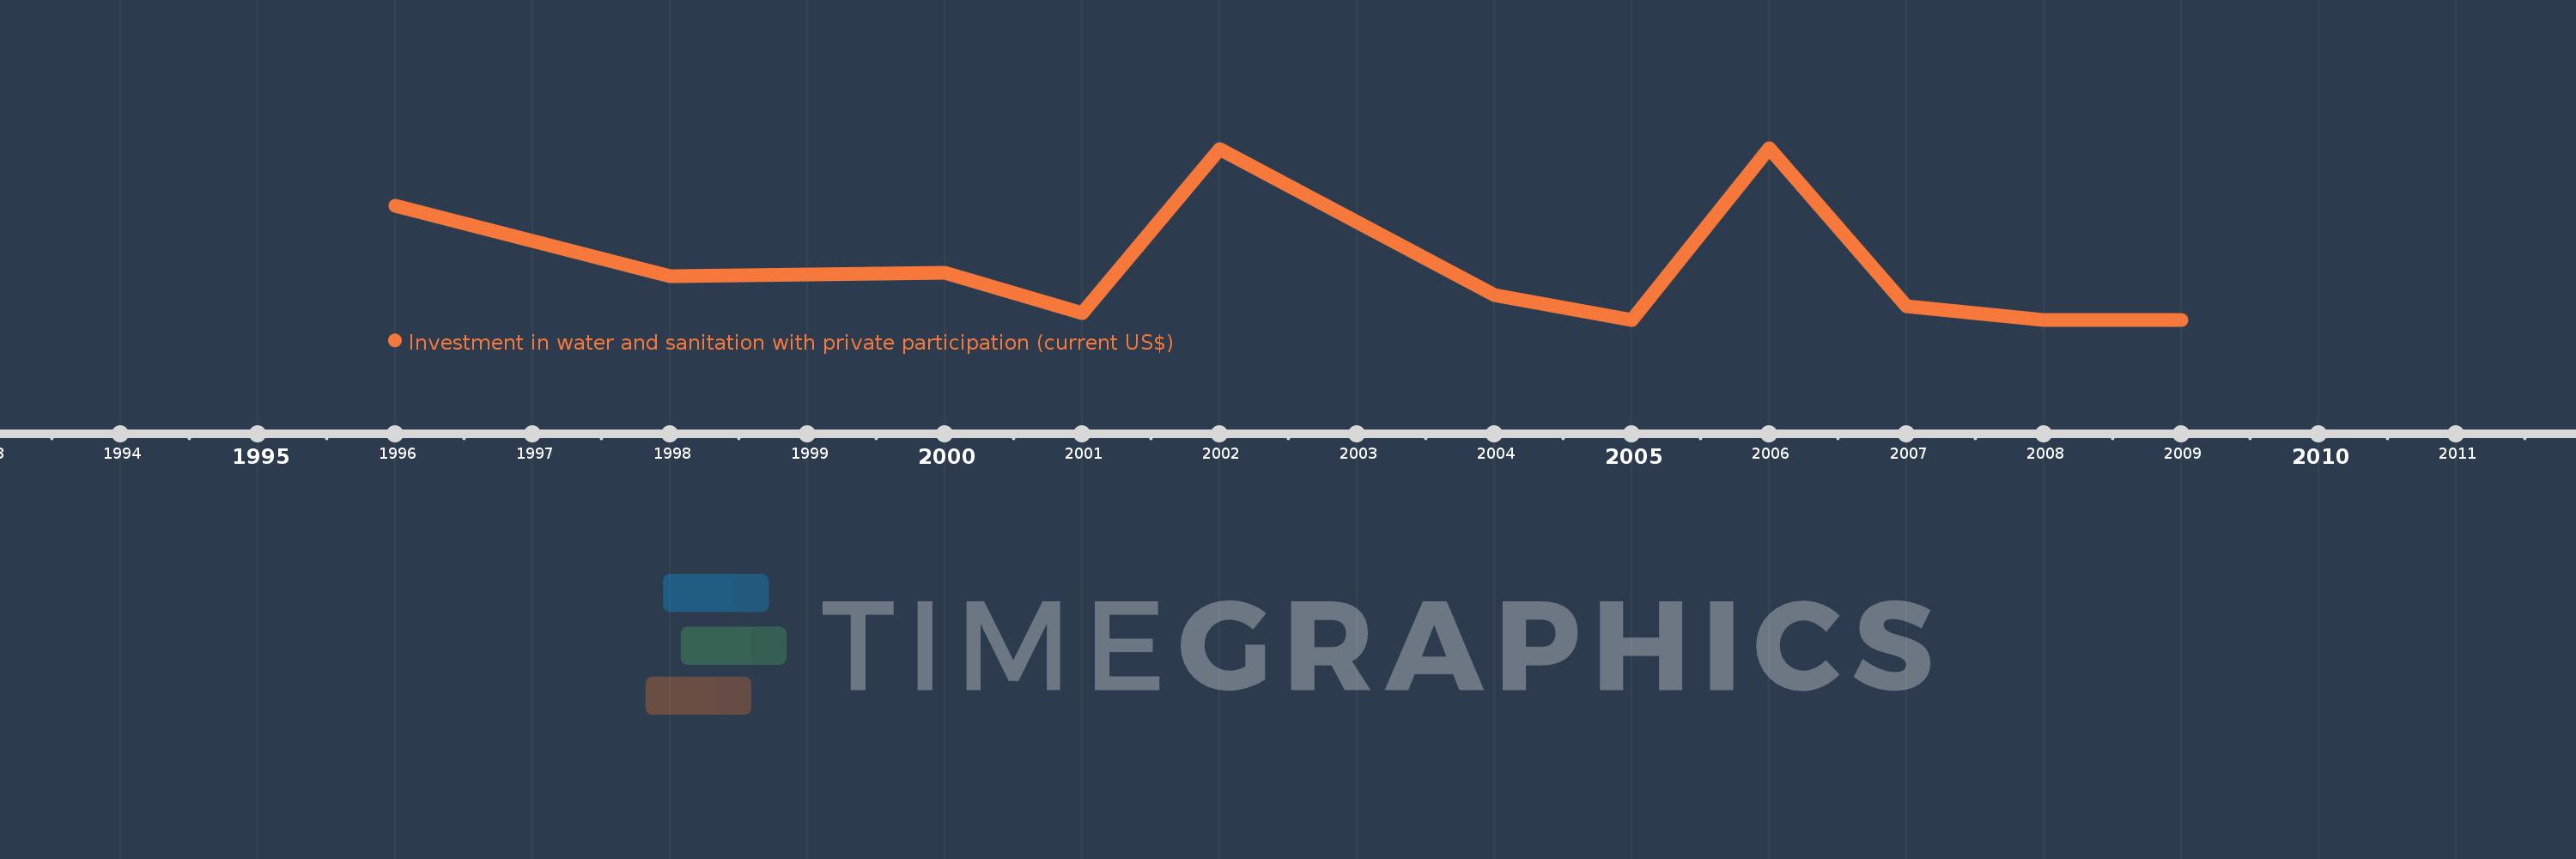
Investment in water and sanitation with private participation (current US$)
2009,2008,2007,2006,2005,2004,2002,2001,2000,1998,1996
Cette statistique dans les autres pays:
La ligne de temps
Cette échelle de temps montre un graphique de 1996 année à 2009 année Thailand. Les données jusqu'à 1995 année ne sont pas présentés. Quantité d'observations actuelles selon dates: 11.
Source (désignation):
Les indicateurs du développement mondiale
Source (organisation):
World Bank, Private Participation in Infrastructure Project Database (http://ppi.worldbank.org).
Catégories:
Infrastructure, Private Sector
Dernière mise à jour
23 avr. 2017
Les indicateurs de changement de valeurs selon les années
Maximum:
241.6 mln.
1 janv. 2006
Pour la date d''observation
Valeur
Changement absolu
Le changement par rapport à la valeur précédente
1 janv. 1996
160.0 mln.
+160.0 mln.
0.0%
1 janv. 1998
61.3 mln.
-98.7 mln.
-61.69%
1 janv. 2000
65.7 mln.
+4.4 mln.
7.18%
1 janv. 2001
8.8 mln.
-56.9 mln.
-86.61%
1 janv. 2002
240.0 mln.
+231.2 mln.
2.63 milles%
1 janv. 2004
34.3 mln.
-205.7 mln.
-85.71%
1 janv. 2005
0.0
-34.3 mln.
-100.0%
1 janv. 2006
241.6 mln.
+241.6 mln.
%
1 janv. 2007
18.8 mln.
-222.8 mln.
-92.22%
1 janv. 2008
0.0
-18.8 mln.
-100.0%
Classement des pays selon les statistiques actuelles par années


Commentaires: