29
/fr/
fr
AIzaSyAYiBZKx7MnpbEhh9jyipgxe19OcubqV5w
April 1, 2024
38253
IDA blend
IDB
false
2
1
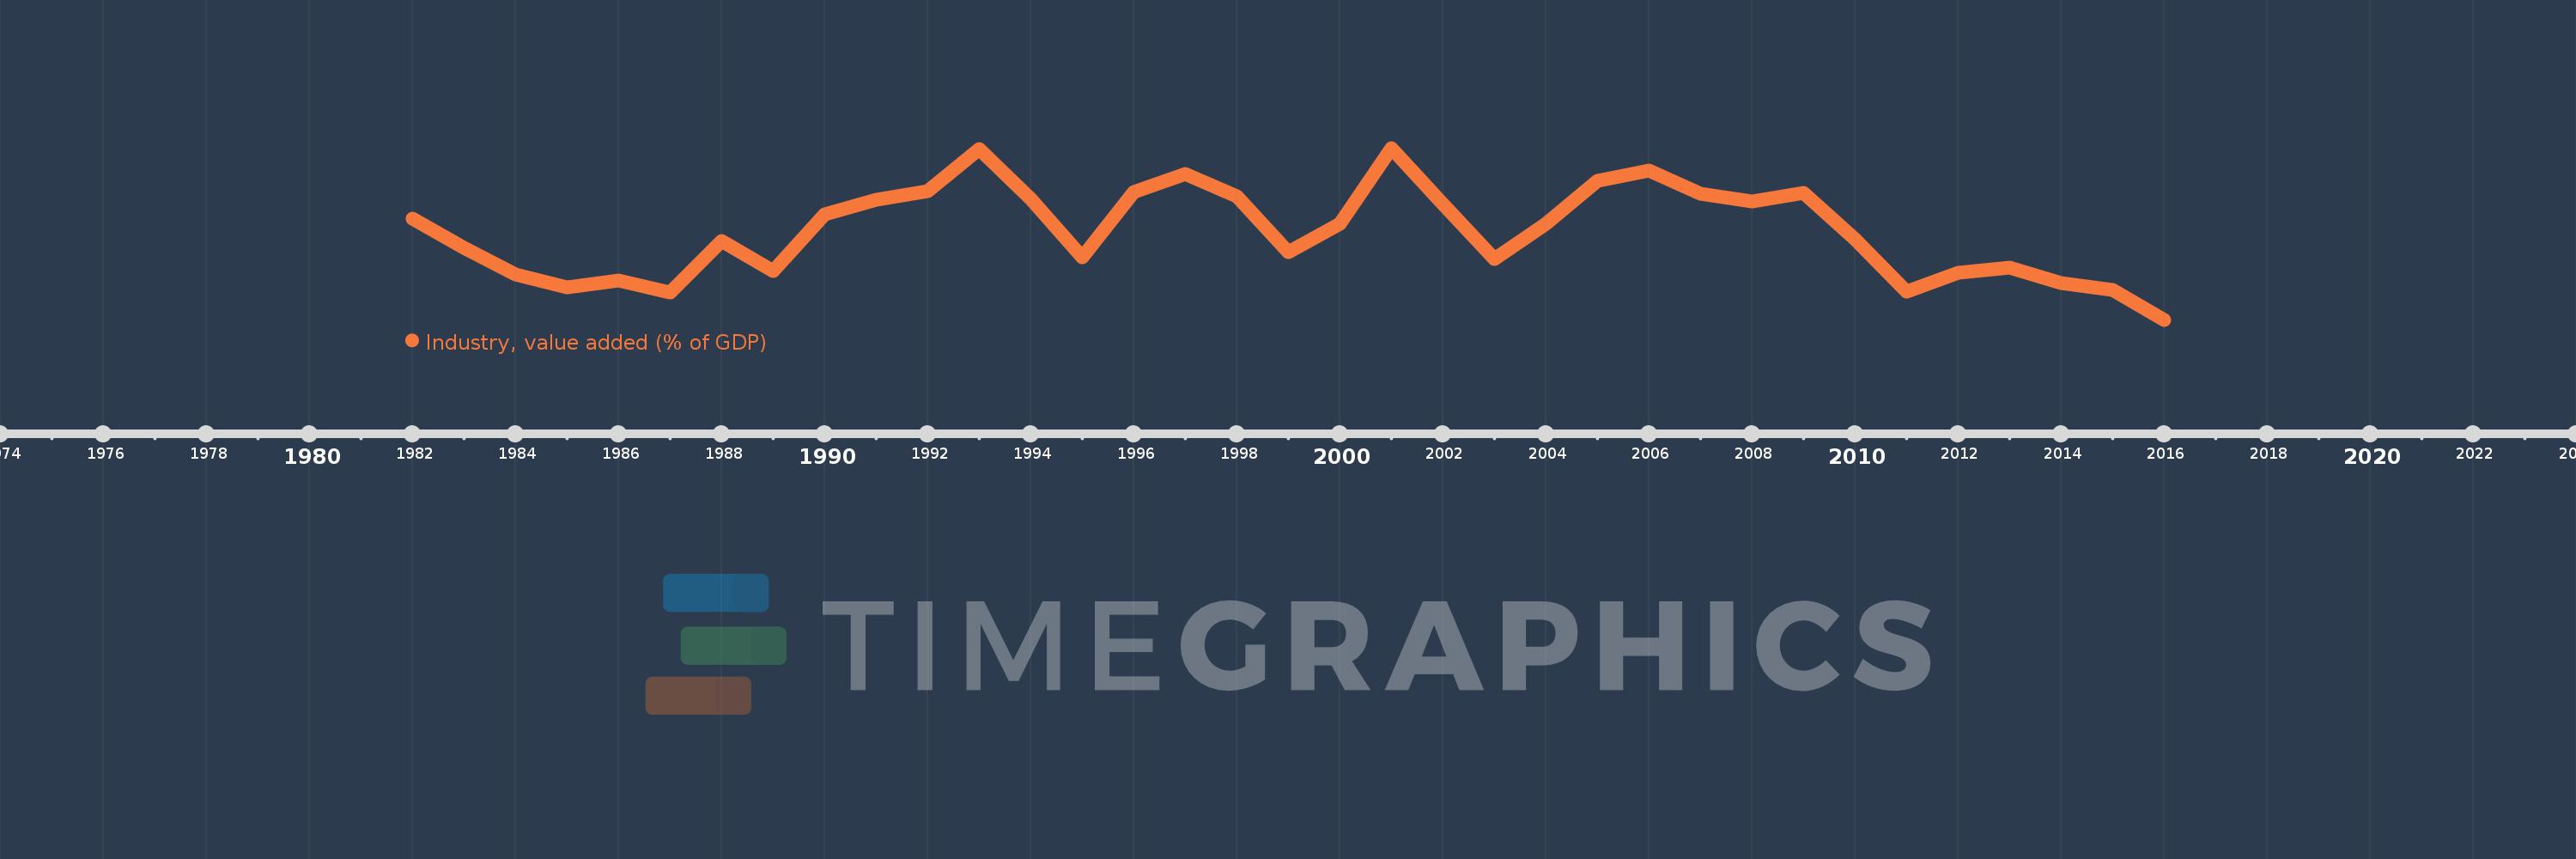
Industry, value added (% of GDP)
2016,2015,2014,2013,2012,2011,2010,2009,2008,2007,2006,2005,2004,2003,2002,2001,2000,1999,1998,1997,1996,1995,1994,1993,1992,1991,1990,1989,1988,1987,1986,1985,1984,1983,1982
Cette statistique dans les autres pays:
AfghanistanAlbaniaAlgeriaAndorraAngolaAntigua and BarbudaArab WorldArgentinaArmeniaArubaAustraliaAustriaAzerbaijanBahamas, TheBahrainBangladeshBarbadosBelarusBelgiumBelizeBeninBermudaBhutanBoliviaBosnia and HerzegovinaBotswanaBrazilBrunei DarussalamBulgariaBurkina FasoBurundiCabo VerdeCambodiaCameroonCanadaCaribbean small statesCayman IslandsCentral African RepublicCentral Europe and the BalticsChadChileChinaColombiaComorosCongo, Dem. Rep.Congo, Rep.Costa RicaCote d'IvoireCroatiaCubaCyprusCzech RepublicDenmarkDjiboutiDominicaDominican RepublicEarly-demographic dividendEast Asia & PacificEast Asia & Pacific (excluding high income)East Asia & Pacific (IDA & IBRD countries)EcuadorEgypt, Arab Rep.El SalvadorEquatorial GuineaEritreaEstoniaEthiopiaEuro areaEurope & Central AsiaEurope & Central Asia (excluding high income)Europe & Central Asia (IDA & IBRD countries)European UnionFijiFinlandFragile and conflict affected situationsFranceGabonGambia, TheGeorgiaGermanyGhanaGreeceGrenadaGuatemalaGuineaGuinea-BissauGuyanaHeavily indebted poor countries (HIPC)High incomeHondurasHong Kong SAR, ChinaHungaryIBRD onlyIcelandIDA & IBRD totalIDA blendIDA onlyIDA totalIndiaIndonesiaIran, Islamic Rep.IrelandItalyJamaicaJapanJordanKazakhstanKenyaKiribatiKorea, Rep.KosovoKuwaitKyrgyz RepublicLao PDRLate-demographic dividendLatin America & Caribbean Latin America & Caribbean (excluding high income)Latin America & the Caribbean (IDA & IBRD countries)LatviaLeast developed countries: UN classificationLebanonLesothoLibyaLiechtensteinLithuaniaLow & middle incomeLow incomeLower middle incomeLuxembourgMacao SAR, ChinaMacedonia, FYRMadagascarMalawiMalaysiaMaldivesMaliMaltaMarshall IslandsMauritaniaMauritiusMexicoMicronesia, Fed. Sts.Middle East & North AfricaMiddle East & North Africa (excluding high income)Middle East & North Africa (IDA & IBRD countries)Middle incomeMoldovaMongoliaMontenegroMoroccoMozambiqueMyanmarNamibiaNepalNetherlandsNew CaledoniaNew ZealandNicaraguaNigerNigeriaNorth AmericaNorwayOECD membersOmanOther small statesPacific island small statesPakistanPalauPanamaPapua New GuineaParaguayPeruPhilippinesPolandPortugalPost-demographic dividendPre-demographic dividendPuerto RicoQatarRomaniaRussian FederationRwandaSao Tome and PrincipeSaudi ArabiaSenegalSerbiaSeychellesSierra LeoneSingaporeSlovak RepublicSloveniaSmall statesSolomon IslandsSomaliaSouth AfricaSouth AsiaSouth Asia (IDA & IBRD)SpainSri LankaSt. Kitts and NevisSt. LuciaSt. Vincent and the GrenadinesSub-Saharan Africa Sub-Saharan Africa (excluding high income)Sub-Saharan Africa (IDA & IBRD countries)SudanSurinameSwazilandSwedenSwitzerlandSyrian Arab RepublicTajikistanTanzaniaThailandTimor-LesteTogoTongaTrinidad and TobagoTunisiaTurkeyTurkmenistanTuvaluUgandaUkraineUnited KingdomUnited StatesUpper middle incomeUruguayUzbekistanVanuatuVenezuela, RBVietnamWest Bank and GazaWorldYemen, Rep.ZambiaZimbabwe La ligne de temps
Cette échelle de temps montre un graphique de 1982 année à 2016 année IDA blend. Les données jusqu'à 1981 année ne sont pas présentés. Quantité d'observations actuelles selon dates: 35.
Source (désignation):
Les indicateurs du développement mondiale
Source (organisation):
World Bank national accounts data, and OECD National Accounts data files.
Catégories:
Economy & Growth
Dernière mise à jour
23 avr. 2017
Les indicateurs de changement de valeurs selon les années
Minimum:
24.98
1 janv. 2016
Maximum:
37.151
1 janv. 2001
Pour la date d''observation
Valeur
Changement absolu
Le changement par rapport à la valeur précédente
1 janv. 1982
32.12
+32.12
0.0%
1 janv. 1983
30.053
-2.067
-6.44%
1 janv. 1984
28.172
-1.881
-6.26%
1 janv. 1985
27.277
-0.895
-3.18%
1 janv. 1986
27.743
+0.466
1.71%
1 janv. 1987
26.931
-0.812
-2.93%
1 janv. 1988
30.569
+3.638
13.51%
1 janv. 1989
28.46
-2.108
-6.9%
1 janv. 1990
32.419
+3.959
13.91%
1 janv. 1991
33.456
+1.037
3.2%
1 janv. 1992
34.085
+0.629
1.88%
1 janv. 1993
37.1
+3.015
8.85%
1 janv. 1994
33.519
-3.581
-9.65%
1 janv. 1995
29.403
-4.116
-12.28%
1 janv. 1996
34.046
+4.644
15.79%
1 janv. 1997
35.303
+1.256
3.69%
1 janv. 1998
33.698
-1.604
-4.54%
1 janv. 1999
29.741
-3.957
-11.74%
1 janv. 2000
31.77
+2.029
6.82%
1 janv. 2001
37.151
+5.381
16.94%
1 janv. 2002
33.192
-3.959
-10.66%
1 janv. 2003
29.293
-3.899
-11.75%
1 janv. 2004
31.764
+2.471
8.44%
1 janv. 2005
34.845
+3.08
9.7%
1 janv. 2006
35.524
+0.679
1.95%
1 janv. 2007
33.908
-1.616
-4.55%
1 janv. 2008
33.381
-0.527
-1.55%
1 janv. 2009
33.938
+0.557
1.67%
1 janv. 2010
30.677
-3.262
-9.61%
1 janv. 2011
26.981
-3.695
-12.05%
1 janv. 2012
28.307
+1.326
4.91%
1 janv. 2013
28.664
+0.357
1.26%
1 janv. 2014
27.585
-1.079
-3.77%
1 janv. 2015
27.109
-0.475
-1.72%
1 janv. 2016
24.98
-2.129
-7.85%
Classement des pays selon les statistiques actuelles par années


Commentaires: