29
/fr/
fr
AIzaSyAYiBZKx7MnpbEhh9jyipgxe19OcubqV5w
April 1, 2024
268132
Tunisia
TUN
true
2
1
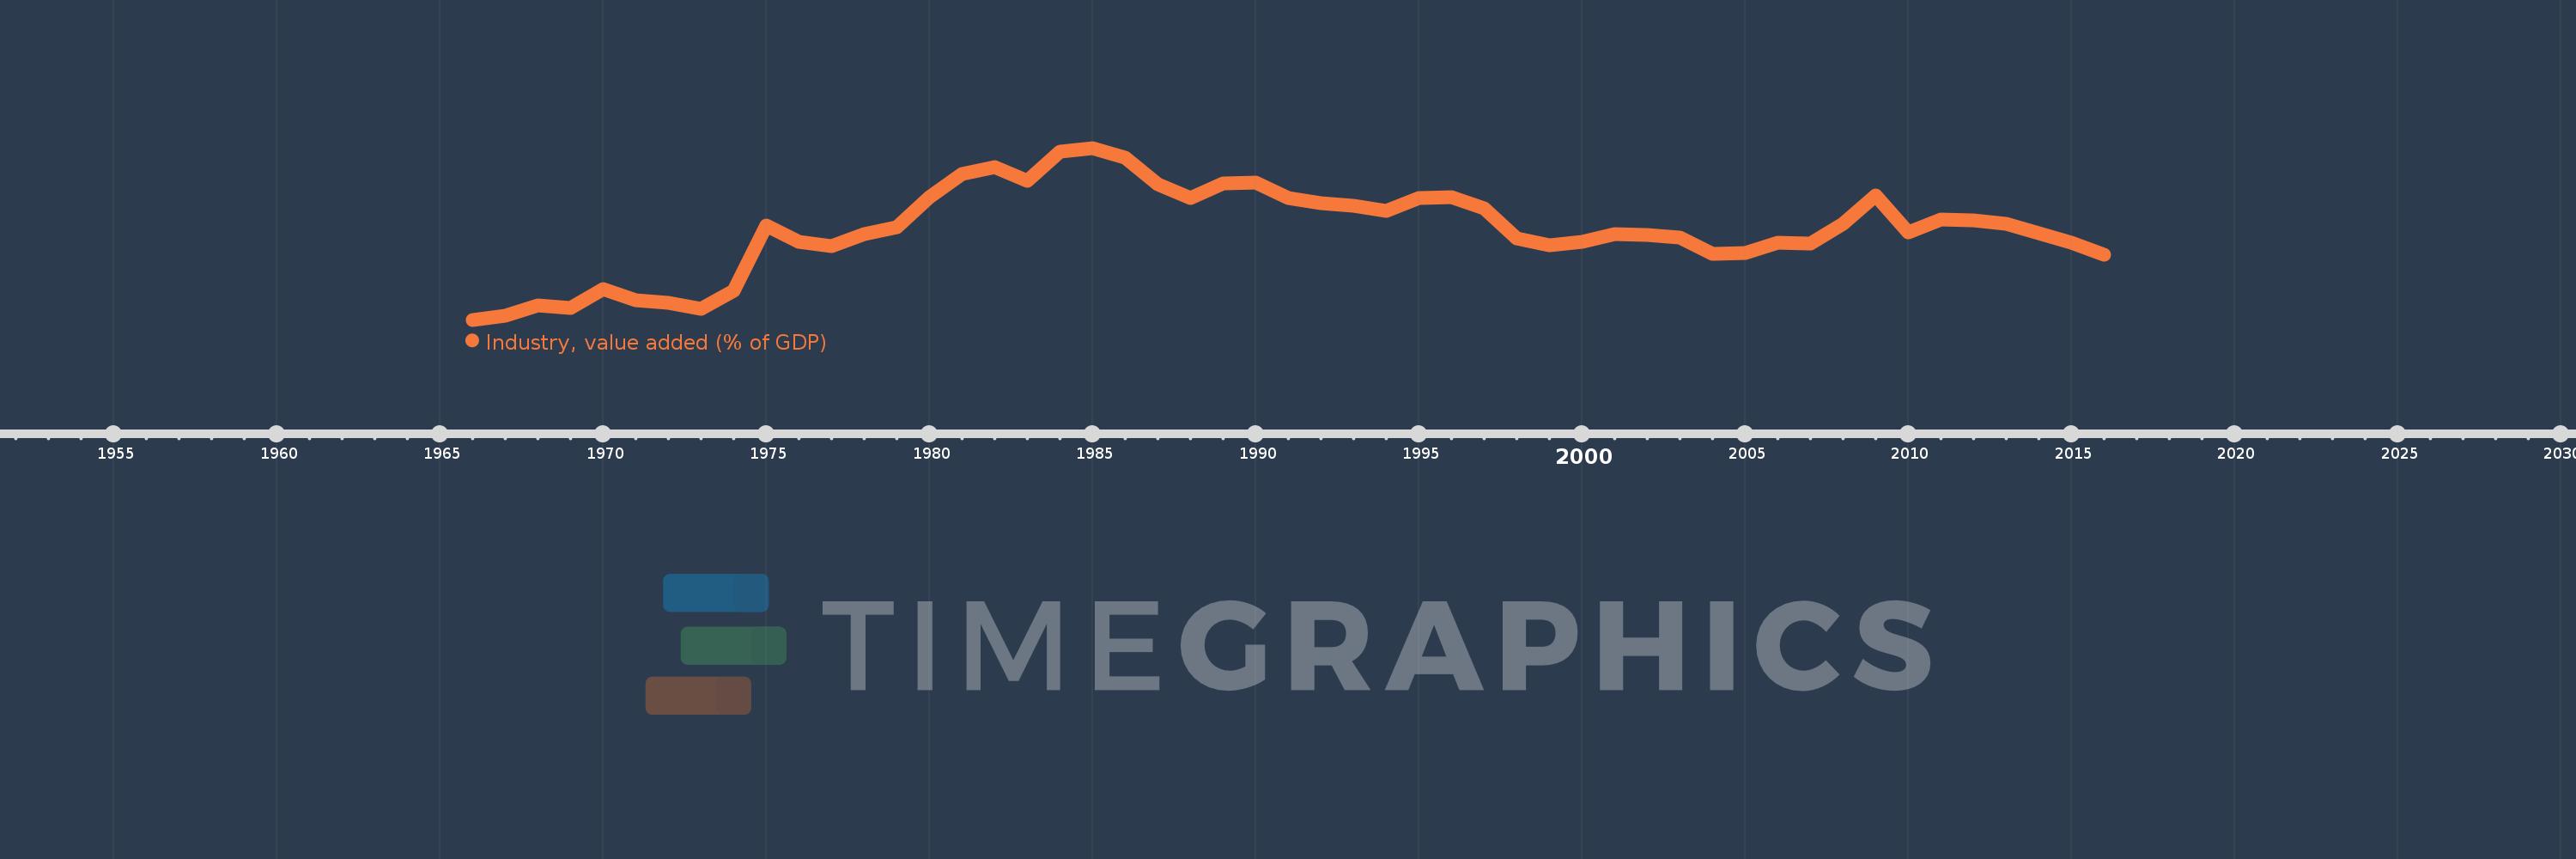
Industry, value added (% of GDP)
2016,2015,2014,2013,2012,2011,2010,2009,2008,2007,2006,2005,2004,2003,2002,2001,2000,1999,1998,1997,1996,1995,1994,1993,1992,1991,1990,1989,1988,1987,1986,1985,1984,1983,1982,1981,1980,1979,1978,1977,1976,1975,1974,1973,1972,1971,1970,1969,1968,1967,1966
Cette statistique dans les autres pays:
AfghanistanAlbaniaAlgeriaAndorraAngolaAntigua and BarbudaArab WorldArgentinaArmeniaArubaAustraliaAustriaAzerbaijanBahamas, TheBahrainBangladeshBarbadosBelarusBelgiumBelizeBeninBermudaBhutanBoliviaBosnia and HerzegovinaBotswanaBrazilBrunei DarussalamBulgariaBurkina FasoBurundiCabo VerdeCambodiaCameroonCanadaCaribbean small statesCayman IslandsCentral African RepublicCentral Europe and the BalticsChadChileChinaColombiaComorosCongo, Dem. Rep.Congo, Rep.Costa RicaCote d'IvoireCroatiaCubaCyprusCzech RepublicDenmarkDjiboutiDominicaDominican RepublicEarly-demographic dividendEast Asia & PacificEast Asia & Pacific (excluding high income)East Asia & Pacific (IDA & IBRD countries)EcuadorEgypt, Arab Rep.El SalvadorEquatorial GuineaEritreaEstoniaEthiopiaEuro areaEurope & Central AsiaEurope & Central Asia (excluding high income)Europe & Central Asia (IDA & IBRD countries)European UnionFijiFinlandFragile and conflict affected situationsFranceGabonGambia, TheGeorgiaGermanyGhanaGreeceGrenadaGuatemalaGuineaGuinea-BissauGuyanaHeavily indebted poor countries (HIPC)High incomeHondurasHong Kong SAR, ChinaHungaryIBRD onlyIcelandIDA & IBRD totalIDA blendIDA onlyIDA totalIndiaIndonesiaIran, Islamic Rep.IrelandItalyJamaicaJapanJordanKazakhstanKenyaKiribatiKorea, Rep.KosovoKuwaitKyrgyz RepublicLao PDRLate-demographic dividendLatin America & Caribbean Latin America & Caribbean (excluding high income)Latin America & the Caribbean (IDA & IBRD countries)LatviaLeast developed countries: UN classificationLebanonLesothoLibyaLiechtensteinLithuaniaLow & middle incomeLow incomeLower middle incomeLuxembourgMacao SAR, ChinaMacedonia, FYRMadagascarMalawiMalaysiaMaldivesMaliMaltaMarshall IslandsMauritaniaMauritiusMexicoMicronesia, Fed. Sts.Middle East & North AfricaMiddle East & North Africa (excluding high income)Middle East & North Africa (IDA & IBRD countries)Middle incomeMoldovaMongoliaMontenegroMoroccoMozambiqueMyanmarNamibiaNepalNetherlandsNew CaledoniaNew ZealandNicaraguaNigerNigeriaNorth AmericaNorwayOECD membersOmanOther small statesPacific island small statesPakistanPalauPanamaPapua New GuineaParaguayPeruPhilippinesPolandPortugalPost-demographic dividendPre-demographic dividendPuerto RicoQatarRomaniaRussian FederationRwandaSao Tome and PrincipeSaudi ArabiaSenegalSerbiaSeychellesSierra LeoneSingaporeSlovak RepublicSloveniaSmall statesSolomon IslandsSomaliaSouth AfricaSouth AsiaSouth Asia (IDA & IBRD)SpainSri LankaSt. Kitts and NevisSt. LuciaSt. Vincent and the GrenadinesSub-Saharan Africa Sub-Saharan Africa (excluding high income)Sub-Saharan Africa (IDA & IBRD countries)SudanSurinameSwazilandSwedenSwitzerlandSyrian Arab RepublicTajikistanTanzaniaThailandTimor-LesteTogoTongaTrinidad and TobagoTunisiaTurkeyTurkmenistanTuvaluUgandaUkraineUnited KingdomUnited StatesUpper middle incomeUruguayUzbekistanVanuatuVenezuela, RBVietnamWest Bank and GazaWorldYemen, Rep.ZambiaZimbabwe La ligne de temps
Cette échelle de temps montre un graphique de 1966 année à 2016 année Tunisia. Les données jusqu'à 1965 année ne sont pas présentés. Quantité d'observations actuelles selon dates: 51.
Source (désignation):
Les indicateurs du développement mondiale
Source (organisation):
World Bank national accounts data, and OECD National Accounts data files.
Catégories:
Economy & Growth
Dernière mise à jour
23 avr. 2017
Les indicateurs de changement de valeurs selon les années
Minimum:
21.939
1 janv. 1966
Maximum:
38.424
1 janv. 1985
Pour la date d''observation
Valeur
Changement absolu
Le changement par rapport à la valeur précédente
1 janv. 1966
21.939
+21.939
0.0%
1 janv. 1967
22.29
+0.351
1.6%
1 janv. 1968
23.285
+0.995
4.46%
1 janv. 1969
23.059
-0.226
-0.97%
1 janv. 1970
24.897
+1.838
7.97%
1 janv. 1971
23.806
-1.091
-4.38%
1 janv. 1972
23.584
-0.222
-0.93%
1 janv. 1973
23.009
-0.575
-2.44%
1 janv. 1974
24.683
+1.674
7.28%
1 janv. 1975
30.947
+6.264
25.38%
1 janv. 1976
29.395
-1.553
-5.02%
1 janv. 1977
28.963
-0.432
-1.47%
1 janv. 1978
30.192
+1.229
4.24%
1 janv. 1979
30.809
+0.618
2.05%
1 janv. 1980
33.678
+2.869
9.31%
1 janv. 1981
35.949
+2.271
6.74%
1 janv. 1982
36.6
+0.652
1.81%
1 janv. 1983
35.295
-1.305
-3.57%
1 janv. 1984
38.09
+2.795
7.92%
1 janv. 1985
38.424
+0.334
0.88%
1 janv. 1986
37.492
-0.931
-2.42%
1 janv. 1987
34.959
-2.533
-6.76%
1 janv. 1988
33.644
-1.315
-3.76%
1 janv. 1989
35.024
+1.379
4.1%
1 janv. 1990
35.09
+0.066
0.19%
1 janv. 1991
33.606
-1.484
-4.23%
1 janv. 1992
33.109
-0.496
-1.48%
1 janv. 1993
32.84
-0.27
-0.81%
1 janv. 1994
32.406
-0.434
-1.32%
1 janv. 1995
33.611
+1.206
3.72%
1 janv. 1996
33.719
+0.108
0.32%
1 janv. 1997
32.602
-1.117
-3.31%
1 janv. 1998
29.736
-2.865
-8.79%
1 janv. 1999
29.095
-0.641
-2.16%
1 janv. 2000
29.433
+0.337
1.16%
1 janv. 2001
30.189
+0.756
2.57%
1 janv. 2002
30.048
-0.141
-0.47%
1 janv. 2003
29.848
-0.199
-0.66%
1 janv. 2004
28.226
-1.622
-5.44%
1 janv. 2005
28.33
+0.105
0.37%
1 janv. 2006
29.294
+0.963
3.4%
1 janv. 2007
29.262
-0.032
-0.11%
1 janv. 2008
31.178
+1.916
6.55%
1 janv. 2009
33.856
+2.678
8.59%
1 janv. 2010
30.329
-3.527
-10.42%
1 janv. 2011
31.537
+1.208
3.98%
1 janv. 2012
31.473
-0.063
-0.2%
1 janv. 2013
31.105
-0.368
-1.17%
1 janv. 2014
30.234
-0.872
-2.8%
1 janv. 2015
29.296
-0.938
-3.1%
1 janv. 2016
28.199
-1.096
-3.74%
Classement des pays selon les statistiques actuelles par années


Commentaires: