29
/fr/
fr
AIzaSyAYiBZKx7MnpbEhh9jyipgxe19OcubqV5w
April 1, 2024
117026
Cyprus
CYP
true
2
1
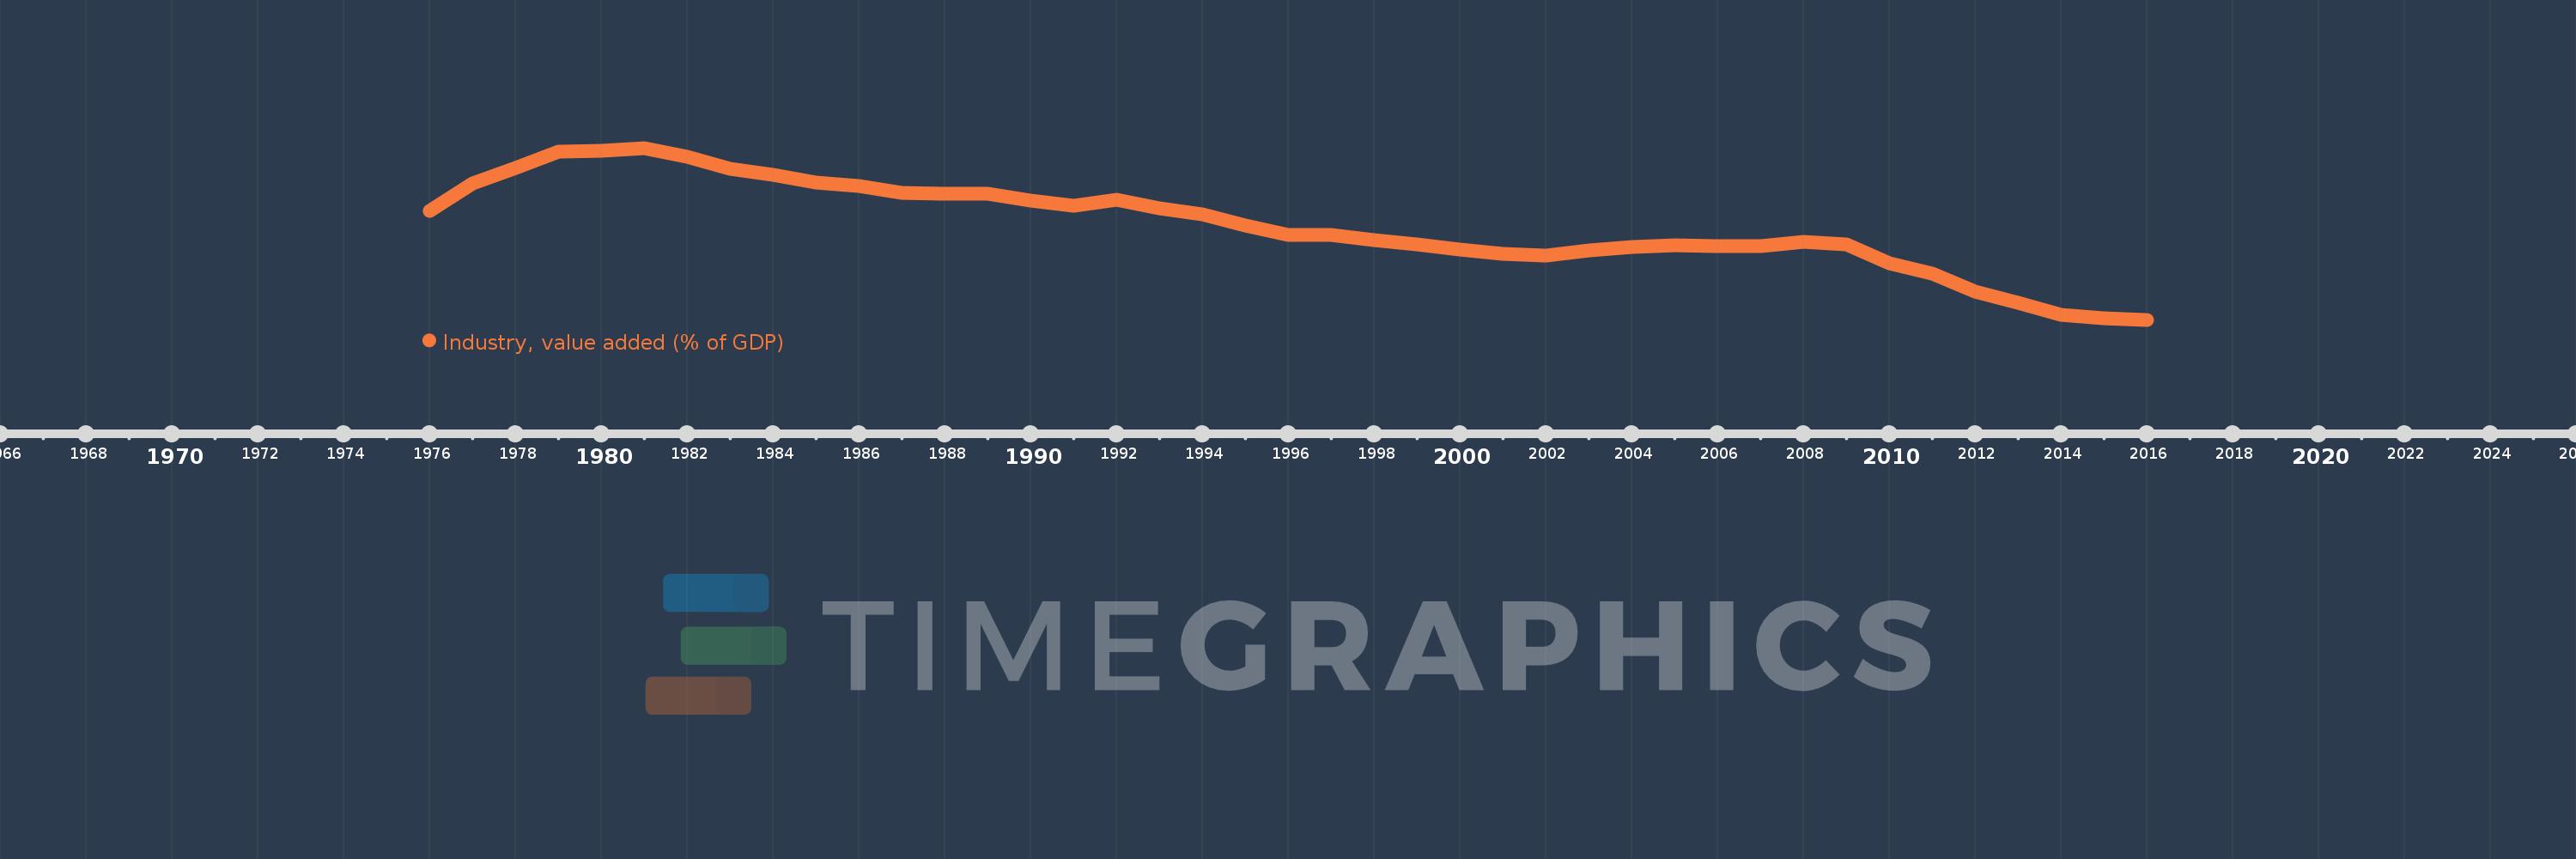
Industry, value added (% of GDP)
2016,2015,2014,2013,2012,2011,2010,2009,2008,2007,2006,2005,2004,2003,2002,2001,2000,1999,1998,1997,1996,1995,1994,1993,1992,1991,1990,1989,1988,1987,1986,1985,1984,1983,1982,1981,1980,1979,1978,1977,1976
Cette statistique dans les autres pays:
AfghanistanAlbaniaAlgeriaAndorraAngolaAntigua and BarbudaArab WorldArgentinaArmeniaArubaAustraliaAustriaAzerbaijanBahamas, TheBahrainBangladeshBarbadosBelarusBelgiumBelizeBeninBermudaBhutanBoliviaBosnia and HerzegovinaBotswanaBrazilBrunei DarussalamBulgariaBurkina FasoBurundiCabo VerdeCambodiaCameroonCanadaCaribbean small statesCayman IslandsCentral African RepublicCentral Europe and the BalticsChadChileChinaColombiaComorosCongo, Dem. Rep.Congo, Rep.Costa RicaCote d'IvoireCroatiaCubaCyprusCzech RepublicDenmarkDjiboutiDominicaDominican RepublicEarly-demographic dividendEast Asia & PacificEast Asia & Pacific (excluding high income)East Asia & Pacific (IDA & IBRD countries)EcuadorEgypt, Arab Rep.El SalvadorEquatorial GuineaEritreaEstoniaEthiopiaEuro areaEurope & Central AsiaEurope & Central Asia (excluding high income)Europe & Central Asia (IDA & IBRD countries)European UnionFijiFinlandFragile and conflict affected situationsFranceGabonGambia, TheGeorgiaGermanyGhanaGreeceGrenadaGuatemalaGuineaGuinea-BissauGuyanaHeavily indebted poor countries (HIPC)High incomeHondurasHong Kong SAR, ChinaHungaryIBRD onlyIcelandIDA & IBRD totalIDA blendIDA onlyIDA totalIndiaIndonesiaIran, Islamic Rep.IrelandItalyJamaicaJapanJordanKazakhstanKenyaKiribatiKorea, Rep.KosovoKuwaitKyrgyz RepublicLao PDRLate-demographic dividendLatin America & Caribbean Latin America & Caribbean (excluding high income)Latin America & the Caribbean (IDA & IBRD countries)LatviaLeast developed countries: UN classificationLebanonLesothoLibyaLiechtensteinLithuaniaLow & middle incomeLow incomeLower middle incomeLuxembourgMacao SAR, ChinaMacedonia, FYRMadagascarMalawiMalaysiaMaldivesMaliMaltaMarshall IslandsMauritaniaMauritiusMexicoMicronesia, Fed. Sts.Middle East & North AfricaMiddle East & North Africa (excluding high income)Middle East & North Africa (IDA & IBRD countries)Middle incomeMoldovaMongoliaMontenegroMoroccoMozambiqueMyanmarNamibiaNepalNetherlandsNew CaledoniaNew ZealandNicaraguaNigerNigeriaNorth AmericaNorwayOECD membersOmanOther small statesPacific island small statesPakistanPalauPanamaPapua New GuineaParaguayPeruPhilippinesPolandPortugalPost-demographic dividendPre-demographic dividendPuerto RicoQatarRomaniaRussian FederationRwandaSao Tome and PrincipeSaudi ArabiaSenegalSerbiaSeychellesSierra LeoneSingaporeSlovak RepublicSloveniaSmall statesSolomon IslandsSomaliaSouth AfricaSouth AsiaSouth Asia (IDA & IBRD)SpainSri LankaSt. Kitts and NevisSt. LuciaSt. Vincent and the GrenadinesSub-Saharan Africa Sub-Saharan Africa (excluding high income)Sub-Saharan Africa (IDA & IBRD countries)SudanSurinameSwazilandSwedenSwitzerlandSyrian Arab RepublicTajikistanTanzaniaThailandTimor-LesteTogoTongaTrinidad and TobagoTunisiaTurkeyTurkmenistanTuvaluUgandaUkraineUnited KingdomUnited StatesUpper middle incomeUruguayUzbekistanVanuatuVenezuela, RBVietnamWest Bank and GazaWorldYemen, Rep.ZambiaZimbabwe La ligne de temps
Cette échelle de temps montre un graphique de 1976 année à 2016 année Cyprus. Les données jusqu'à 1975 année ne sont pas présentés. Quantité d'observations actuelles selon dates: 41.
Source (désignation):
Les indicateurs du développement mondiale
Source (organisation):
World Bank national accounts data, and OECD National Accounts data files.
Catégories:
Economy & Growth
Dernière mise à jour
23 avr. 2017
Les indicateurs de changement de valeurs selon les années
Minimum:
10.556
1 janv. 2016
Maximum:
33.645
1 janv. 1981
Pour la date d''observation
Valeur
Changement absolu
Le changement par rapport à la valeur précédente
1 janv. 1976
25.175
+25.175
0.0%
1 janv. 1977
28.841
+3.666
14.56%
1 janv. 1978
30.986
+2.145
7.44%
1 janv. 1979
33.129
+2.144
6.92%
1 janv. 1980
33.217
+0.088
0.26%
1 janv. 1981
33.645
+0.428
1.29%
1 janv. 1982
32.409
-1.236
-3.67%
1 janv. 1983
30.862
-1.547
-4.77%
1 janv. 1984
30.087
-0.774
-2.51%
1 janv. 1985
29.026
-1.061
-3.53%
1 janv. 1986
28.491
-0.535
-1.84%
1 janv. 1987
27.591
-0.901
-3.16%
1 janv. 1988
27.497
-0.094
-0.34%
1 janv. 1989
27.501
+0.004
0.02%
1 janv. 1990
26.576
-0.925
-3.36%
1 janv. 1991
25.926
-0.65
-2.45%
1 janv. 1992
26.739
+0.813
3.14%
1 janv. 1993
25.56
-1.179
-4.41%
1 janv. 1994
24.68
-0.88
-3.44%
1 janv. 1995
23.226
-1.454
-5.89%
1 janv. 1996
21.979
-1.247
-5.37%
1 janv. 1997
21.964
-0.015
-0.07%
1 janv. 1998
21.308
-0.655
-2.98%
1 janv. 1999
20.712
-0.596
-2.8%
1 janv. 2000
19.961
-0.751
-3.63%
1 janv. 2001
19.41
-0.551
-2.76%
1 janv. 2002
19.201
-0.21
-1.08%
1 janv. 2003
19.895
+0.695
3.62%
1 janv. 2004
20.303
+0.407
2.05%
1 janv. 2005
20.537
+0.234
1.15%
1 janv. 2006
20.478
-0.059
-0.28%
1 janv. 2007
20.471
-0.007
-0.03%
1 janv. 2008
21.081
+0.61
2.98%
1 janv. 2009
20.724
-0.358
-1.7%
1 janv. 2010
18.146
-2.578
-12.44%
1 janv. 2011
16.711
-1.435
-7.91%
1 janv. 2012
14.307
-2.405
-14.39%
1 janv. 2013
12.838
-1.468
-10.26%
1 janv. 2014
11.266
-1.572
-12.24%
1 janv. 2015
10.72
-0.546
-4.85%
1 janv. 2016
10.556
-0.164
-1.53%
Classement des pays selon les statistiques actuelles par années


Commentaires: