29
/fr/
fr
AIzaSyAYiBZKx7MnpbEhh9jyipgxe19OcubqV5w
April 1, 2024
32830
Europe & Central Asia (IDA & IBRD countries)
TEC
false
2
1
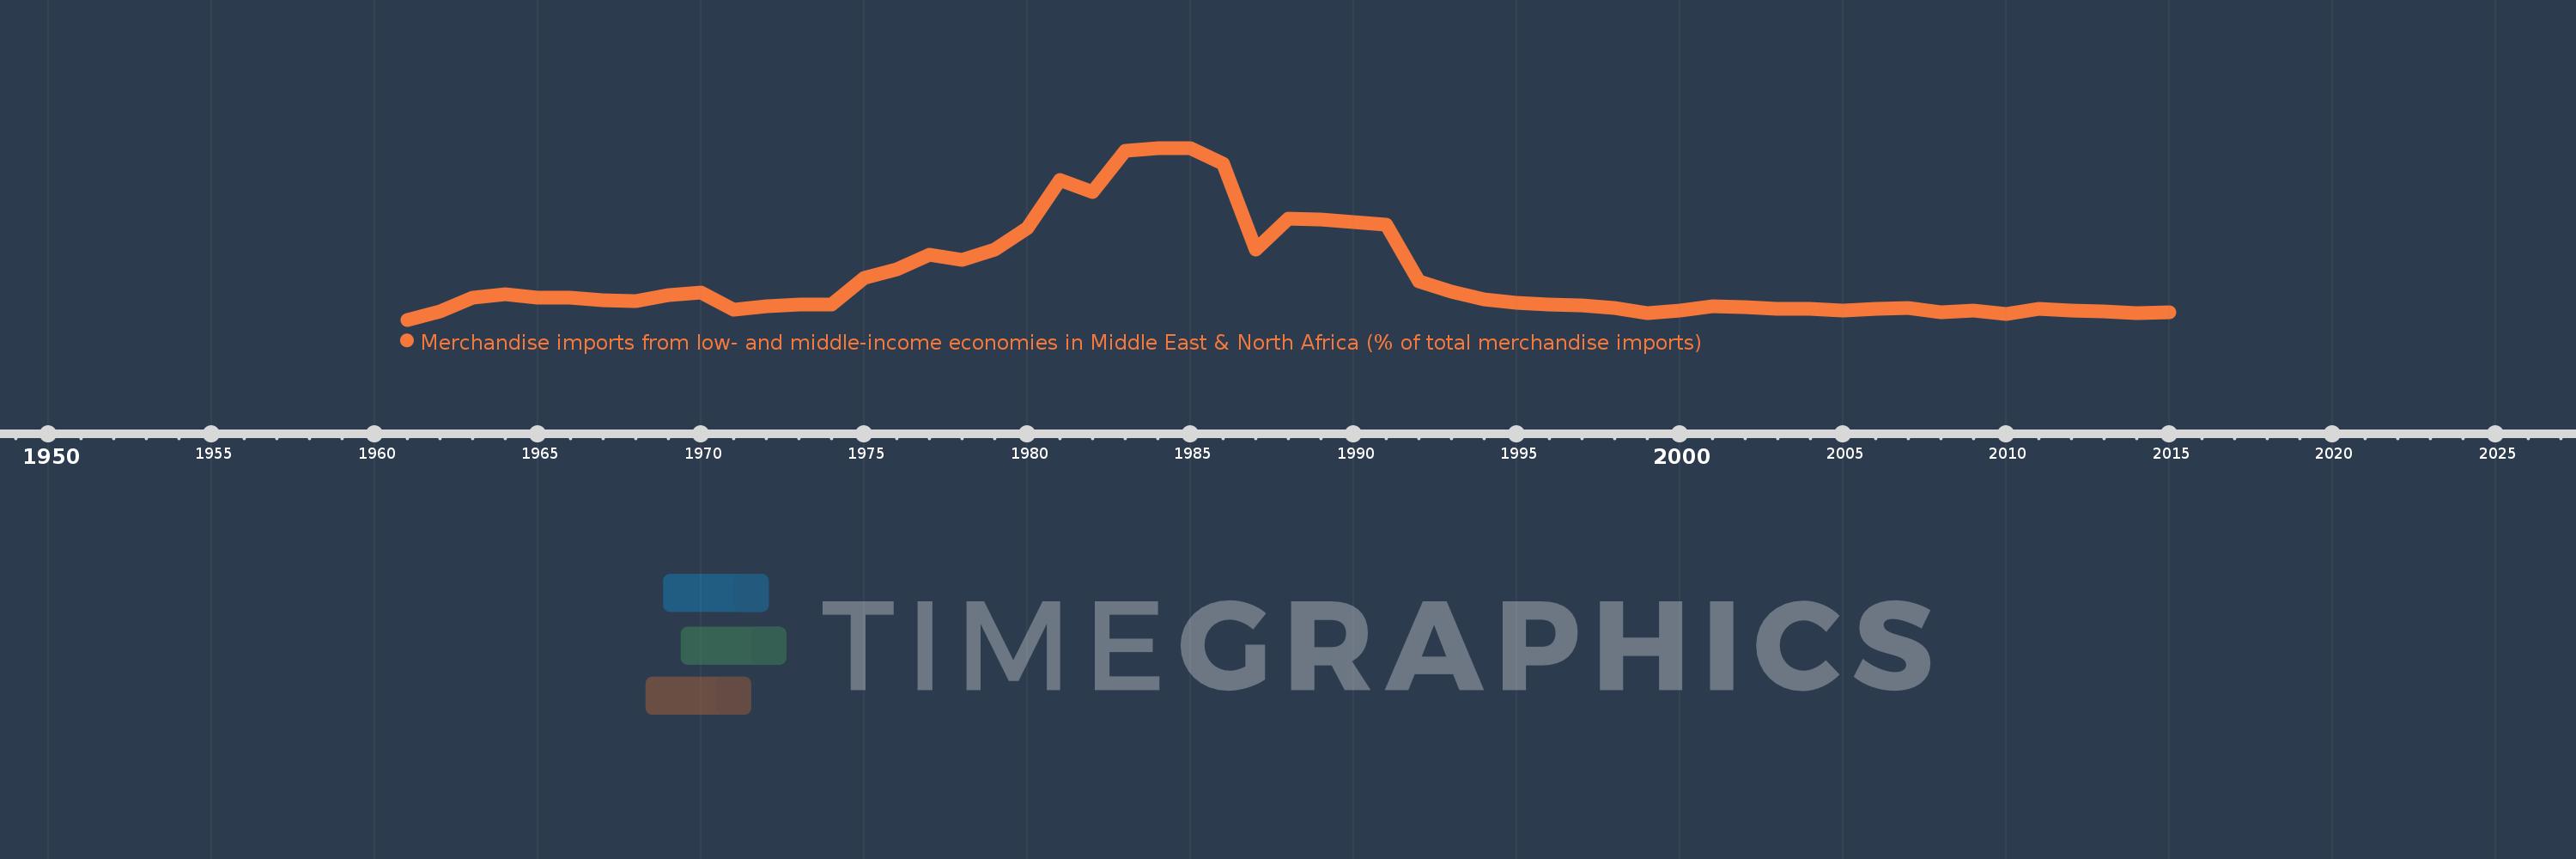
Merchandise imports from low- and middle-income economies in Middle East & North Africa (% of total merchandise imports)
2015,2014,2013,2012,2011,2010,2009,2008,2007,2006,2005,2004,2003,2002,2001,2000,1999,1998,1997,1996,1995,1994,1993,1992,1991,1990,1989,1988,1987,1986,1985,1984,1983,1982,1981,1980,1979,1978,1977,1976,1975,1974,1973,1972,1971,1970,1969,1968,1967,1966,1965,1964,1963,1962,1961
Cette statistique dans les autres pays:
AfghanistanAlbaniaAlgeriaAngolaArab WorldArgentinaArmeniaArubaAustraliaAustriaAzerbaijanBahamas, TheBahrainBangladeshBarbadosBelarusBelgiumBelizeBeninBermudaBoliviaBosnia and HerzegovinaBrazilBrunei DarussalamBulgariaBurkina FasoBurundiCabo VerdeCambodiaCameroonCanadaCaribbean small statesCentral African RepublicCentral Europe and the BalticsChadChileChinaColombiaComorosCongo, Dem. Rep.Congo, Rep.Costa RicaCote d'IvoireCroatiaCubaCyprusCzech RepublicDenmarkDjiboutiDominicaDominican RepublicEarly-demographic dividendEast Asia & PacificEast Asia & Pacific (excluding high income)East Asia & Pacific (IDA & IBRD countries)EcuadorEgypt, Arab Rep.El SalvadorEstoniaEthiopiaEuro areaEurope & Central AsiaEurope & Central Asia (excluding high income)Europe & Central Asia (IDA & IBRD countries)European UnionFijiFinlandFragile and conflict affected situationsFranceFrench PolynesiaGabonGambia, TheGeorgiaGermanyGhanaGreeceGreenlandGrenadaGuatemalaGuineaGuinea-BissauGuyanaHaitiHeavily indebted poor countries (HIPC)High incomeHondurasHong Kong SAR, ChinaHungaryIBRD onlyIcelandIDA & IBRD totalIDA blendIDA onlyIDA totalIndiaIndonesiaIran, Islamic Rep.IraqIrelandIsraelItalyJamaicaJapanJordanKazakhstanKenyaKorea, Dem. People’s Rep.Korea, Rep.KosovoKuwaitKyrgyz RepublicLao PDRLate-demographic dividendLatin America & Caribbean Latin America & Caribbean (excluding high income)Latin America & the Caribbean (IDA & IBRD countries)LatviaLeast developed countries: UN classificationLebanonLiberiaLibyaLithuaniaLow & middle incomeLow incomeLower middle incomeLuxembourgMacao SAR, ChinaMacedonia, FYRMadagascarMalawiMalaysiaMaldivesMaliMaltaMauritaniaMauritiusMexicoMiddle East & North AfricaMiddle East & North Africa (excluding high income)Middle East & North Africa (IDA & IBRD countries)Middle incomeMoldovaMongoliaMontenegroMoroccoMozambiqueMyanmarNepalNetherlandsNew CaledoniaNew ZealandNicaraguaNigerNigeriaNorth AmericaNorwayOECD membersOmanOther small statesPacific island small statesPakistanPanamaPapua New GuineaParaguayPeruPhilippinesPolandPortugalPost-demographic dividendPre-demographic dividendQatarRomaniaRussian FederationRwandaSamoaSaudi ArabiaSenegalSerbiaSeychellesSierra LeoneSingaporeSlovak RepublicSloveniaSmall statesSomaliaSouth AfricaSouth AsiaSouth Asia (IDA & IBRD)SpainSri LankaSt. Kitts and NevisSt. LuciaSt. Vincent and the GrenadinesSub-Saharan Africa Sub-Saharan Africa (excluding high income)Sub-Saharan Africa (IDA & IBRD countries)SudanSurinameSwedenSwitzerlandSyrian Arab RepublicTajikistanTanzaniaThailandTogoTrinidad and TobagoTunisiaTurkeyTurkmenistanUgandaUkraineUnited Arab EmiratesUnited KingdomUnited StatesUpper middle incomeUruguayUzbekistanVenezuela, RBVietnamWorldYemen, Rep.ZambiaZimbabwe La ligne de temps
Cette échelle de temps montre un graphique de 1961 année à 2015 année Europe & Central Asia (IDA & IBRD countries). Les données jusqu'à 1960 année ne sont pas présentés. Quantité d'observations actuelles selon dates: 55.
Source (désignation):
Les indicateurs du développement mondiale
Source (organisation):
World Bank staff estimates based data from International Monetary Fund's Direction of Trade database.
Catégories:
Private Sector, Trade
Dernière mise à jour
23 avr. 2017
Les indicateurs de changement de valeurs selon les années
Minimum:
0.933
1 janv. 1961
Maximum:
18.136
1 janv. 1984
Pour la date d''observation
Valeur
Changement absolu
Le changement par rapport à la valeur précédente
1 janv. 1961
0.933
+0.933
0.0%
1 janv. 1962
1.787
+0.854
91.52%
1 janv. 1963
3.121
+1.334
74.68%
1 janv. 1964
3.501
+0.379
12.15%
1 janv. 1965
3.113
-0.387
-11.06%
1 janv. 1966
3.104
-0.009
-0.3%
1 janv. 1967
2.843
-0.261
-8.4%
1 janv. 1968
2.785
-0.058
-2.04%
1 janv. 1969
3.381
+0.596
21.4%
1 janv. 1970
3.628
+0.247
7.31%
1 janv. 1971
1.976
-1.653
-45.55%
1 janv. 1972
2.321
+0.346
17.49%
1 janv. 1973
2.494
+0.172
7.43%
1 janv. 1974
2.489
-0.004
-0.16%
1 janv. 1975
5.151
+2.662
106.92%
1 janv. 1976
5.969
+0.817
15.87%
1 janv. 1977
7.447
+1.478
24.77%
1 janv. 1978
6.909
-0.537
-7.22%
1 janv. 1979
7.923
+1.013
14.66%
1 janv. 1980
10.143
+2.22
28.03%
1 janv. 1981
14.938
+4.795
47.27%
1 janv. 1982
13.69
-1.248
-8.35%
1 janv. 1983
17.851
+4.161
30.39%
1 janv. 1984
18.136
+0.285
1.6%
1 janv. 1985
18.079
-0.058
-0.32%
1 janv. 1986
16.576
-1.503
-8.31%
1 janv. 1987
8.003
-8.573
-51.72%
1 janv. 1988
11.027
+3.024
37.79%
1 janv. 1989
10.978
-0.049
-0.44%
1 janv. 1990
10.736
-0.242
-2.2%
1 janv. 1991
10.421
-0.315
-2.93%
1 janv. 1992
4.794
-5.627
-54.0%
1 janv. 1993
3.755
-1.039
-21.67%
1 janv. 1994
2.95
-0.805
-21.45%
1 janv. 1995
2.594
-0.356
-12.08%
1 janv. 1996
2.438
-0.156
-6.0%
1 janv. 1997
2.393
-0.045
-1.84%
1 janv. 1998
2.118
-0.275
-11.51%
1 janv. 1999
1.622
-0.495
-23.39%
1 janv. 2000
1.855
+0.232
14.33%
1 janv. 2001
2.26
+0.405
21.84%
1 janv. 2002
2.233
-0.027
-1.22%
1 janv. 2003
2.009
-0.224
-10.02%
1 janv. 2004
2.058
+0.049
2.45%
1 janv. 2005
1.856
-0.202
-9.8%
1 janv. 2006
2.064
+0.208
11.19%
1 janv. 2007
2.124
+0.06
2.88%
1 janv. 2008
1.722
-0.402
-18.93%
1 janv. 2009
1.861
+0.139
8.08%
1 janv. 2010
1.525
-0.336
-18.05%
1 janv. 2011
1.992
+0.467
30.65%
1 janv. 2012
1.887
-0.105
-5.27%
1 janv. 2013
1.793
-0.094
-4.98%
1 janv. 2014
1.631
-0.162
-9.02%
1 janv. 2015
1.703
+0.072
4.41%
Classement des pays selon les statistiques actuelles par années


Commentaires: