29
/fr/
fr
AIzaSyAYiBZKx7MnpbEhh9jyipgxe19OcubqV5w
April 1, 2024
253296
Sudan
SDN
true
2
1
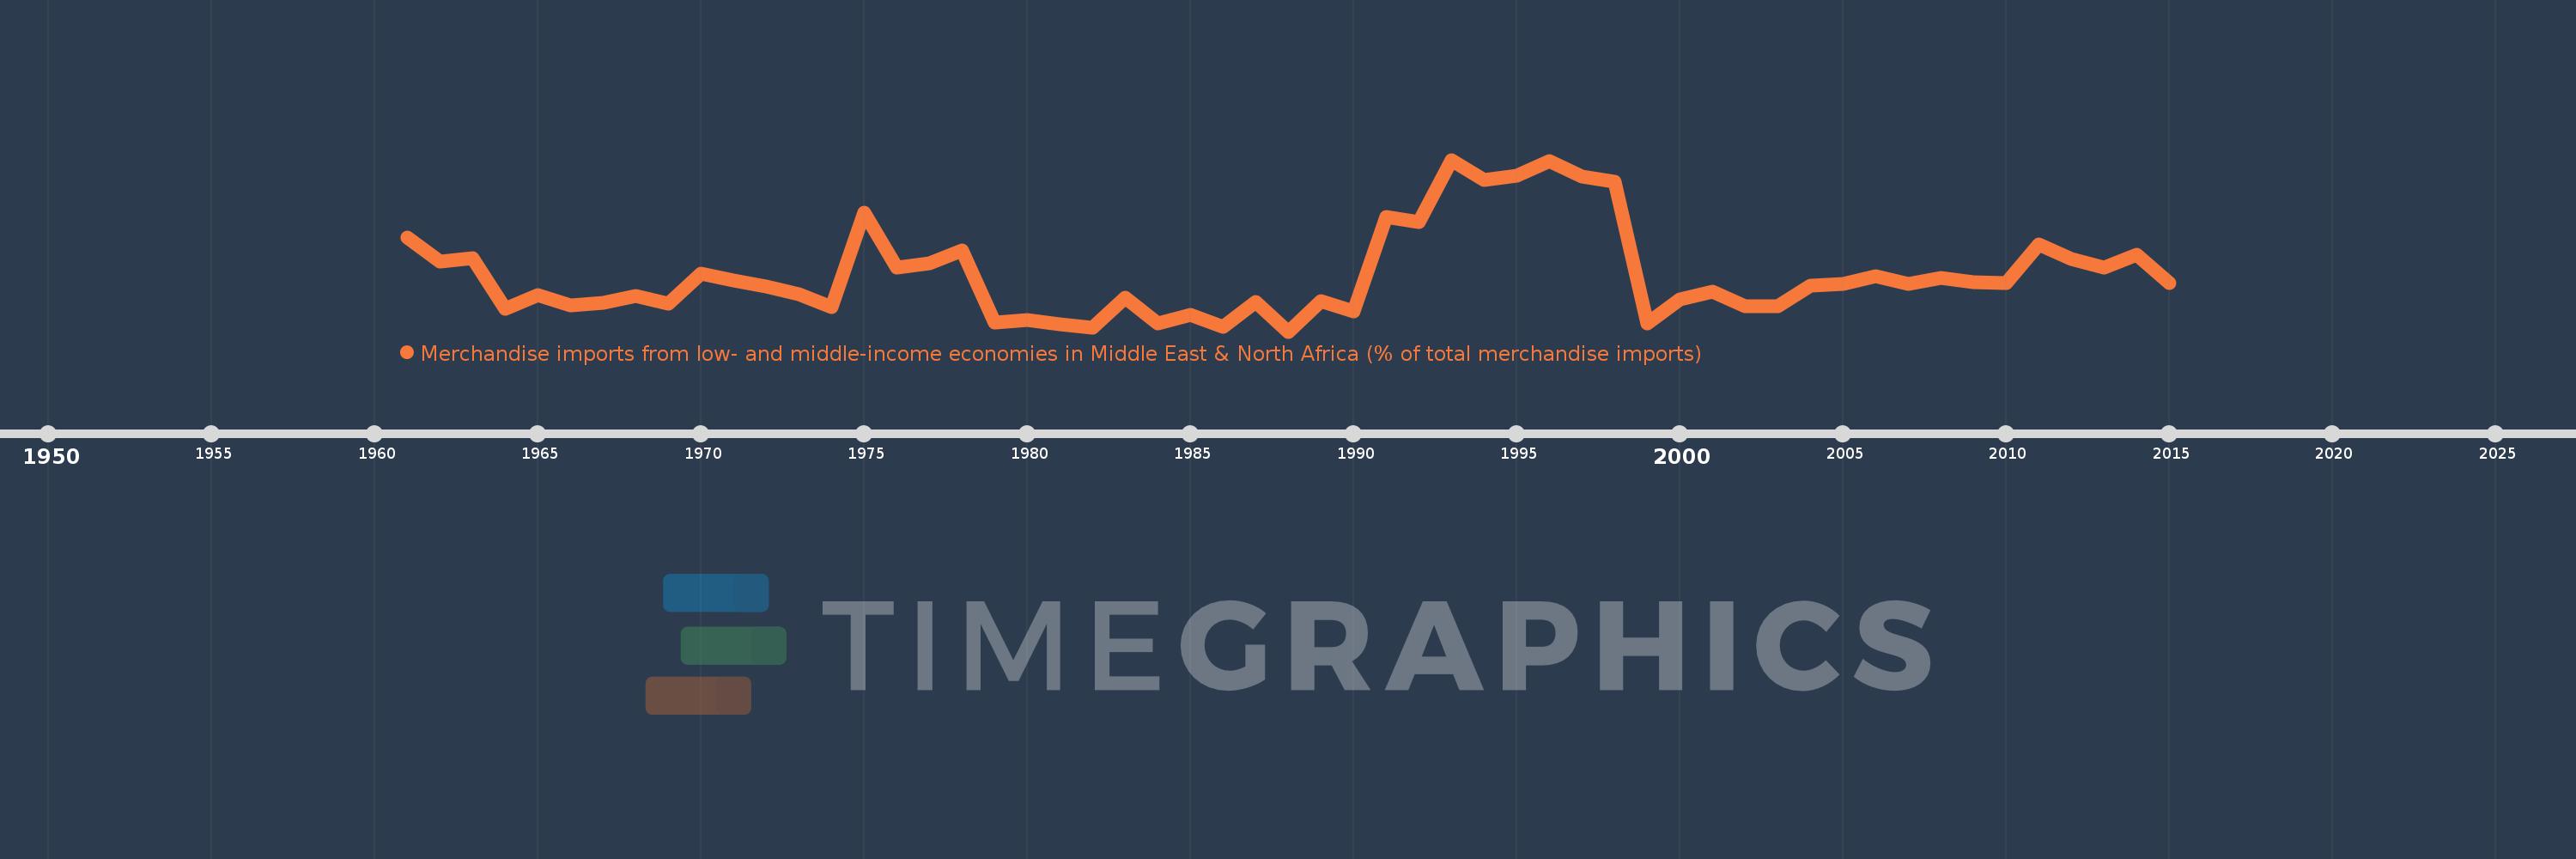
Merchandise imports from low- and middle-income economies in Middle East & North Africa (% of total merchandise imports)
2015,2014,2013,2012,2011,2010,2009,2008,2007,2006,2005,2004,2003,2002,2001,2000,1999,1998,1997,1996,1995,1994,1993,1992,1991,1990,1989,1988,1987,1986,1985,1984,1983,1982,1981,1980,1979,1978,1977,1976,1975,1974,1973,1972,1971,1970,1969,1968,1967,1966,1965,1964,1963,1962,1961
Cette statistique dans les autres pays:
AfghanistanAlbaniaAlgeriaAngolaArab WorldArgentinaArmeniaArubaAustraliaAustriaAzerbaijanBahamas, TheBahrainBangladeshBarbadosBelarusBelgiumBelizeBeninBermudaBoliviaBosnia and HerzegovinaBrazilBrunei DarussalamBulgariaBurkina FasoBurundiCabo VerdeCambodiaCameroonCanadaCaribbean small statesCentral African RepublicCentral Europe and the BalticsChadChileChinaColombiaComorosCongo, Dem. Rep.Congo, Rep.Costa RicaCote d'IvoireCroatiaCubaCyprusCzech RepublicDenmarkDjiboutiDominicaDominican RepublicEarly-demographic dividendEast Asia & PacificEast Asia & Pacific (excluding high income)East Asia & Pacific (IDA & IBRD countries)EcuadorEgypt, Arab Rep.El SalvadorEstoniaEthiopiaEuro areaEurope & Central AsiaEurope & Central Asia (excluding high income)Europe & Central Asia (IDA & IBRD countries)European UnionFijiFinlandFragile and conflict affected situationsFranceFrench PolynesiaGabonGambia, TheGeorgiaGermanyGhanaGreeceGreenlandGrenadaGuatemalaGuineaGuinea-BissauGuyanaHaitiHeavily indebted poor countries (HIPC)High incomeHondurasHong Kong SAR, ChinaHungaryIBRD onlyIcelandIDA & IBRD totalIDA blendIDA onlyIDA totalIndiaIndonesiaIran, Islamic Rep.IraqIrelandIsraelItalyJamaicaJapanJordanKazakhstanKenyaKorea, Dem. People’s Rep.Korea, Rep.KosovoKuwaitKyrgyz RepublicLao PDRLate-demographic dividendLatin America & Caribbean Latin America & Caribbean (excluding high income)Latin America & the Caribbean (IDA & IBRD countries)LatviaLeast developed countries: UN classificationLebanonLiberiaLibyaLithuaniaLow & middle incomeLow incomeLower middle incomeLuxembourgMacao SAR, ChinaMacedonia, FYRMadagascarMalawiMalaysiaMaldivesMaliMaltaMauritaniaMauritiusMexicoMiddle East & North AfricaMiddle East & North Africa (excluding high income)Middle East & North Africa (IDA & IBRD countries)Middle incomeMoldovaMongoliaMontenegroMoroccoMozambiqueMyanmarNepalNetherlandsNew CaledoniaNew ZealandNicaraguaNigerNigeriaNorth AmericaNorwayOECD membersOmanOther small statesPacific island small statesPakistanPanamaPapua New GuineaParaguayPeruPhilippinesPolandPortugalPost-demographic dividendPre-demographic dividendQatarRomaniaRussian FederationRwandaSamoaSaudi ArabiaSenegalSerbiaSeychellesSierra LeoneSingaporeSlovak RepublicSloveniaSmall statesSomaliaSouth AfricaSouth AsiaSouth Asia (IDA & IBRD)SpainSri LankaSt. Kitts and NevisSt. LuciaSt. Vincent and the GrenadinesSub-Saharan Africa Sub-Saharan Africa (excluding high income)Sub-Saharan Africa (IDA & IBRD countries)SudanSurinameSwedenSwitzerlandSyrian Arab RepublicTajikistanTanzaniaThailandTogoTrinidad and TobagoTunisiaTurkeyTurkmenistanUgandaUkraineUnited Arab EmiratesUnited KingdomUnited StatesUpper middle incomeUruguayUzbekistanVenezuela, RBVietnamWorldYemen, Rep.ZambiaZimbabwe La ligne de temps
Cette échelle de temps montre un graphique de 1961 année à 2015 année Sudan. Les données jusqu'à 1960 année ne sont pas présentés. Quantité d'observations actuelles selon dates: 55.
Source (désignation):
Les indicateurs du développement mondiale
Source (organisation):
World Bank staff estimates based data from International Monetary Fund's Direction of Trade database.
Catégories:
Private Sector, Trade
Dernière mise à jour
23 avr. 2017
Les indicateurs de changement de valeurs selon les années
Minimum:
0.947
1 janv. 1988
Maximum:
24.241
1 janv. 1993
Pour la date d''observation
Valeur
Changement absolu
Le changement par rapport à la valeur précédente
1 janv. 1961
13.684
+13.684
0.0%
1 janv. 1962
10.398
-3.286
-24.01%
1 janv. 1963
10.886
+0.487
4.69%
1 janv. 1964
3.979
-6.907
-63.45%
1 janv. 1965
5.857
+1.878
47.19%
1 janv. 1966
4.521
-1.335
-22.8%
1 janv. 1967
4.854
+0.333
7.35%
1 janv. 1968
5.816
+0.962
19.82%
1 janv. 1969
4.697
-1.119
-19.24%
1 janv. 1970
8.865
+4.168
88.73%
1 janv. 1971
7.843
-1.022
-11.53%
1 janv. 1972
7.069
-0.774
-9.87%
1 janv. 1973
6.02
-1.049
-14.84%
1 janv. 1974
4.221
-1.8
-29.9%
1 janv. 1975
17.037
+12.817
303.67%
1 janv. 1976
9.651
-7.387
-43.36%
1 janv. 1977
10.251
+0.6
6.22%
1 janv. 1978
11.953
+1.702
16.6%
1 janv. 1979
2.16
-9.793
-81.93%
1 janv. 1980
2.506
+0.346
16.01%
1 janv. 1981
1.95
-0.556
-22.2%
1 janv. 1982
1.455
-0.495
-25.37%
1 janv. 1983
5.546
+4.091
281.19%
1 janv. 1984
2.015
-3.531
-63.67%
1 janv. 1985
3.188
+1.173
58.2%
1 janv. 1986
1.625
-1.563
-49.03%
1 janv. 1987
4.998
+3.374
207.65%
1 janv. 1988
0.947
-4.052
-81.06%
1 janv. 1989
5.036
+4.089
431.89%
1 janv. 1990
3.666
-1.37
-27.21%
1 janv. 1991
16.44
+12.774
348.49%
1 janv. 1992
15.848
-0.592
-3.6%
1 janv. 1993
24.241
+8.393
52.96%
1 janv. 1994
21.452
-2.789
-11.51%
1 janv. 1995
22.078
+0.626
2.92%
1 janv. 1996
24.086
+2.008
9.1%
1 janv. 1997
22.013
-2.073
-8.61%
1 janv. 1998
21.264
-0.749
-3.4%
1 janv. 1999
2.05
-19.214
-90.36%
1 janv. 2000
5.311
+3.261
159.05%
1 janv. 2001
6.36
+1.049
19.74%
1 janv. 2002
4.365
-1.994
-31.36%
1 janv. 2003
4.433
+0.068
1.55%
1 janv. 2004
7.131
+2.698
60.86%
1 janv. 2005
7.46
+0.329
4.61%
1 janv. 2006
8.411
+0.952
12.76%
1 janv. 2007
7.362
-1.05
-12.48%
1 janv. 2008
8.196
+0.834
11.34%
1 janv. 2009
7.693
-0.503
-6.14%
1 janv. 2010
7.554
-0.139
-1.81%
1 janv. 2011
12.771
+5.217
69.06%
1 janv. 2012
10.809
-1.962
-15.36%
1 janv. 2013
9.568
-1.241
-11.48%
1 janv. 2014
11.376
+1.808
18.9%
1 janv. 2015
7.54
-3.836
-33.72%
Classement des pays selon les statistiques actuelles par années


Commentaires: