29
/fr/
fr
AIzaSyAYiBZKx7MnpbEhh9jyipgxe19OcubqV5w
April 1, 2024
208202
Netherlands
NLD
true
2
1
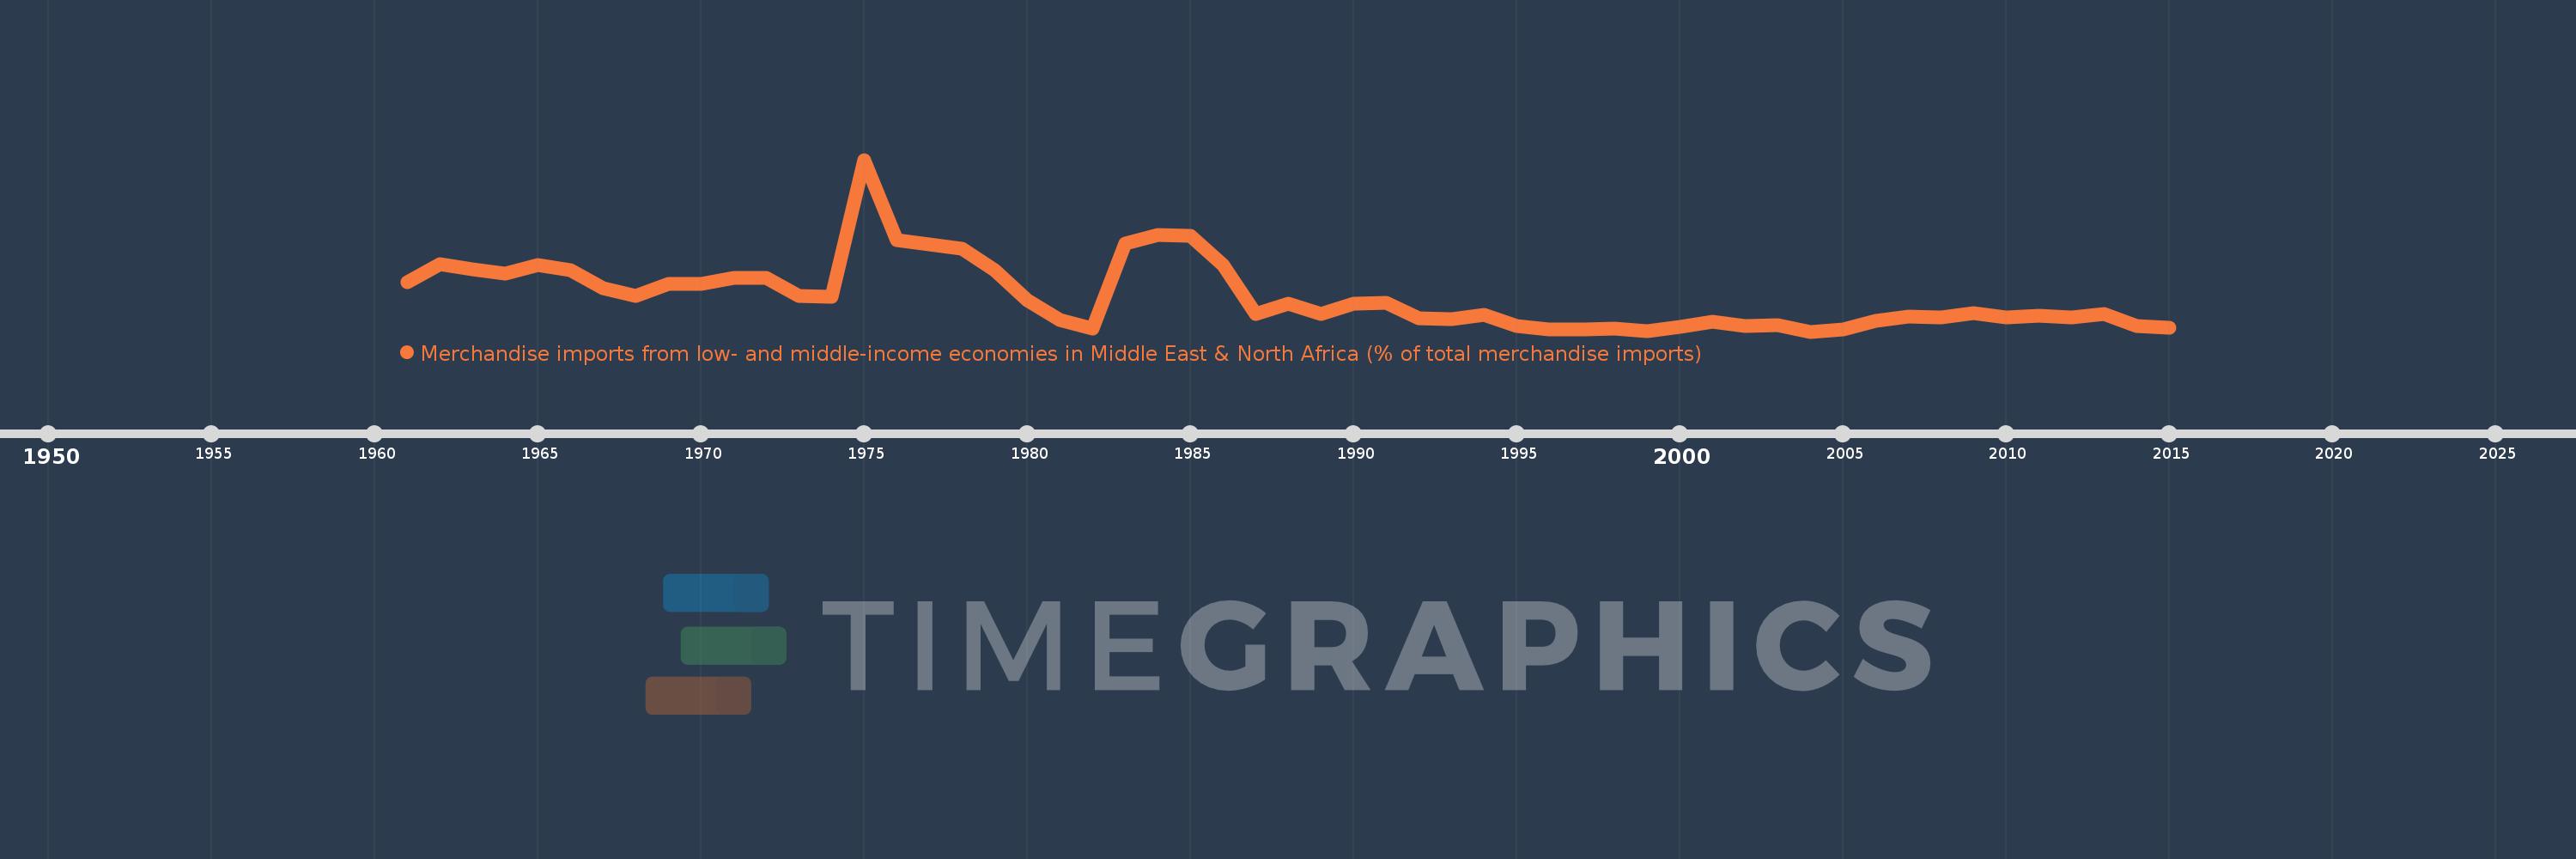
Merchandise imports from low- and middle-income economies in Middle East & North Africa (% of total merchandise imports)
2015,2014,2013,2012,2011,2010,2009,2008,2007,2006,2005,2004,2003,2002,2001,2000,1999,1998,1997,1996,1995,1994,1993,1992,1991,1990,1989,1988,1987,1986,1985,1984,1983,1982,1981,1980,1979,1978,1977,1976,1975,1974,1973,1972,1971,1970,1969,1968,1967,1966,1965,1964,1963,1962,1961
Cette statistique dans les autres pays:
AfghanistanAlbaniaAlgeriaAngolaArab WorldArgentinaArmeniaArubaAustraliaAustriaAzerbaijanBahamas, TheBahrainBangladeshBarbadosBelarusBelgiumBelizeBeninBermudaBoliviaBosnia and HerzegovinaBrazilBrunei DarussalamBulgariaBurkina FasoBurundiCabo VerdeCambodiaCameroonCanadaCaribbean small statesCentral African RepublicCentral Europe and the BalticsChadChileChinaColombiaComorosCongo, Dem. Rep.Congo, Rep.Costa RicaCote d'IvoireCroatiaCubaCyprusCzech RepublicDenmarkDjiboutiDominicaDominican RepublicEarly-demographic dividendEast Asia & PacificEast Asia & Pacific (excluding high income)East Asia & Pacific (IDA & IBRD countries)EcuadorEgypt, Arab Rep.El SalvadorEstoniaEthiopiaEuro areaEurope & Central AsiaEurope & Central Asia (excluding high income)Europe & Central Asia (IDA & IBRD countries)European UnionFijiFinlandFragile and conflict affected situationsFranceFrench PolynesiaGabonGambia, TheGeorgiaGermanyGhanaGreeceGreenlandGrenadaGuatemalaGuineaGuinea-BissauGuyanaHaitiHeavily indebted poor countries (HIPC)High incomeHondurasHong Kong SAR, ChinaHungaryIBRD onlyIcelandIDA & IBRD totalIDA blendIDA onlyIDA totalIndiaIndonesiaIran, Islamic Rep.IraqIrelandIsraelItalyJamaicaJapanJordanKazakhstanKenyaKorea, Dem. People’s Rep.Korea, Rep.KosovoKuwaitKyrgyz RepublicLao PDRLate-demographic dividendLatin America & Caribbean Latin America & Caribbean (excluding high income)Latin America & the Caribbean (IDA & IBRD countries)LatviaLeast developed countries: UN classificationLebanonLiberiaLibyaLithuaniaLow & middle incomeLow incomeLower middle incomeLuxembourgMacao SAR, ChinaMacedonia, FYRMadagascarMalawiMalaysiaMaldivesMaliMaltaMauritaniaMauritiusMexicoMiddle East & North AfricaMiddle East & North Africa (excluding high income)Middle East & North Africa (IDA & IBRD countries)Middle incomeMoldovaMongoliaMontenegroMoroccoMozambiqueMyanmarNepalNetherlandsNew CaledoniaNew ZealandNicaraguaNigerNigeriaNorth AmericaNorwayOECD membersOmanOther small statesPacific island small statesPakistanPanamaPapua New GuineaParaguayPeruPhilippinesPolandPortugalPost-demographic dividendPre-demographic dividendQatarRomaniaRussian FederationRwandaSamoaSaudi ArabiaSenegalSerbiaSeychellesSierra LeoneSingaporeSlovak RepublicSloveniaSmall statesSomaliaSouth AfricaSouth AsiaSouth Asia (IDA & IBRD)SpainSri LankaSt. Kitts and NevisSt. LuciaSt. Vincent and the GrenadinesSub-Saharan Africa Sub-Saharan Africa (excluding high income)Sub-Saharan Africa (IDA & IBRD countries)SudanSurinameSwedenSwitzerlandSyrian Arab RepublicTajikistanTanzaniaThailandTogoTrinidad and TobagoTunisiaTurkeyTurkmenistanUgandaUkraineUnited Arab EmiratesUnited KingdomUnited StatesUpper middle incomeUruguayUzbekistanVenezuela, RBVietnamWorldYemen, Rep.ZambiaZimbabwe La ligne de temps
Cette échelle de temps montre un graphique de 1961 année à 2015 année Netherlands. Les données jusqu'à 1960 année ne sont pas présentés. Quantité d'observations actuelles selon dates: 55.
Source (désignation):
Les indicateurs du développement mondiale
Source (organisation):
World Bank staff estimates based data from International Monetary Fund's Direction of Trade database.
Catégories:
Private Sector, Trade
Dernière mise à jour
23 avr. 2017
Les indicateurs de changement de valeurs selon les années
Minimum:
1.292
1 janv. 2004
Maximum:
9.422
1 janv. 1975
Pour la date d''observation
Valeur
Changement absolu
Le changement par rapport à la valeur précédente
1 janv. 1961
3.631
+3.631
0.0%
1 janv. 1962
4.481
+0.849
23.39%
1 janv. 1963
4.245
-0.235
-5.25%
1 janv. 1964
4.042
-0.203
-4.78%
1 janv. 1965
4.445
+0.403
9.97%
1 janv. 1966
4.187
-0.258
-5.8%
1 janv. 1967
3.335
-0.853
-20.37%
1 janv. 1968
2.962
-0.373
-11.18%
1 janv. 1969
3.558
+0.596
20.13%
1 janv. 1970
3.53
-0.028
-0.79%
1 janv. 1971
3.848
+0.318
8.99%
1 janv. 1972
3.847
-0.001
-0.03%
1 janv. 1973
2.979
-0.867
-22.55%
1 janv. 1974
2.948
-0.031
-1.05%
1 janv. 1975
9.422
+6.474
219.59%
1 janv. 1976
5.618
-3.805
-40.38%
1 janv. 1977
5.423
-0.194
-3.46%
1 janv. 1978
5.195
-0.228
-4.2%
1 janv. 1979
4.204
-0.991
-19.07%
1 janv. 1980
2.761
-1.444
-34.33%
1 janv. 1981
1.821
-0.94
-34.04%
1 janv. 1982
1.453
-0.369
-20.24%
1 janv. 1983
5.459
+4.006
275.8%
1 janv. 1984
5.866
+0.407
7.45%
1 janv. 1985
5.814
-0.052
-0.89%
1 janv. 1986
4.44
-1.374
-23.63%
1 janv. 1987
2.138
-2.302
-51.85%
1 janv. 1988
2.598
+0.46
21.53%
1 janv. 1989
2.129
-0.469
-18.04%
1 janv. 1990
2.62
+0.49
23.02%
1 janv. 1991
2.652
+0.032
1.22%
1 janv. 1992
1.907
-0.744
-28.07%
1 janv. 1993
1.867
-0.04
-2.11%
1 janv. 1994
2.103
+0.236
12.66%
1 janv. 1995
1.555
-0.548
-26.05%
1 janv. 1996
1.389
-0.166
-10.7%
1 janv. 1997
1.395
+0.006
0.46%
1 janv. 1998
1.428
+0.032
2.3%
1 janv. 1999
1.323
-0.104
-7.31%
1 janv. 2000
1.501
+0.178
13.45%
1 janv. 2001
1.742
+0.241
16.04%
1 janv. 2002
1.543
-0.199
-11.43%
1 janv. 2003
1.611
+0.069
4.44%
1 janv. 2004
1.292
-0.319
-19.82%
1 janv. 2005
1.411
+0.119
9.24%
1 janv. 2006
1.809
+0.398
28.21%
1 janv. 2007
1.997
+0.187
10.34%
1 janv. 2008
1.953
-0.044
-2.19%
1 janv. 2009
2.179
+0.226
11.6%
1 janv. 2010
1.968
-0.211
-9.68%
1 janv. 2011
2.059
+0.091
4.62%
1 janv. 2012
1.969
-0.09
-4.37%
1 janv. 2013
2.12
+0.151
7.65%
1 janv. 2014
1.543
-0.577
-27.2%
1 janv. 2015
1.455
-0.089
-5.74%
Classement des pays selon les statistiques actuelles par années


Commentaires: