29
/fr/
fr
AIzaSyAYiBZKx7MnpbEhh9jyipgxe19OcubqV5w
April 1, 2024
30380
Euro area
EMU
false
2
1
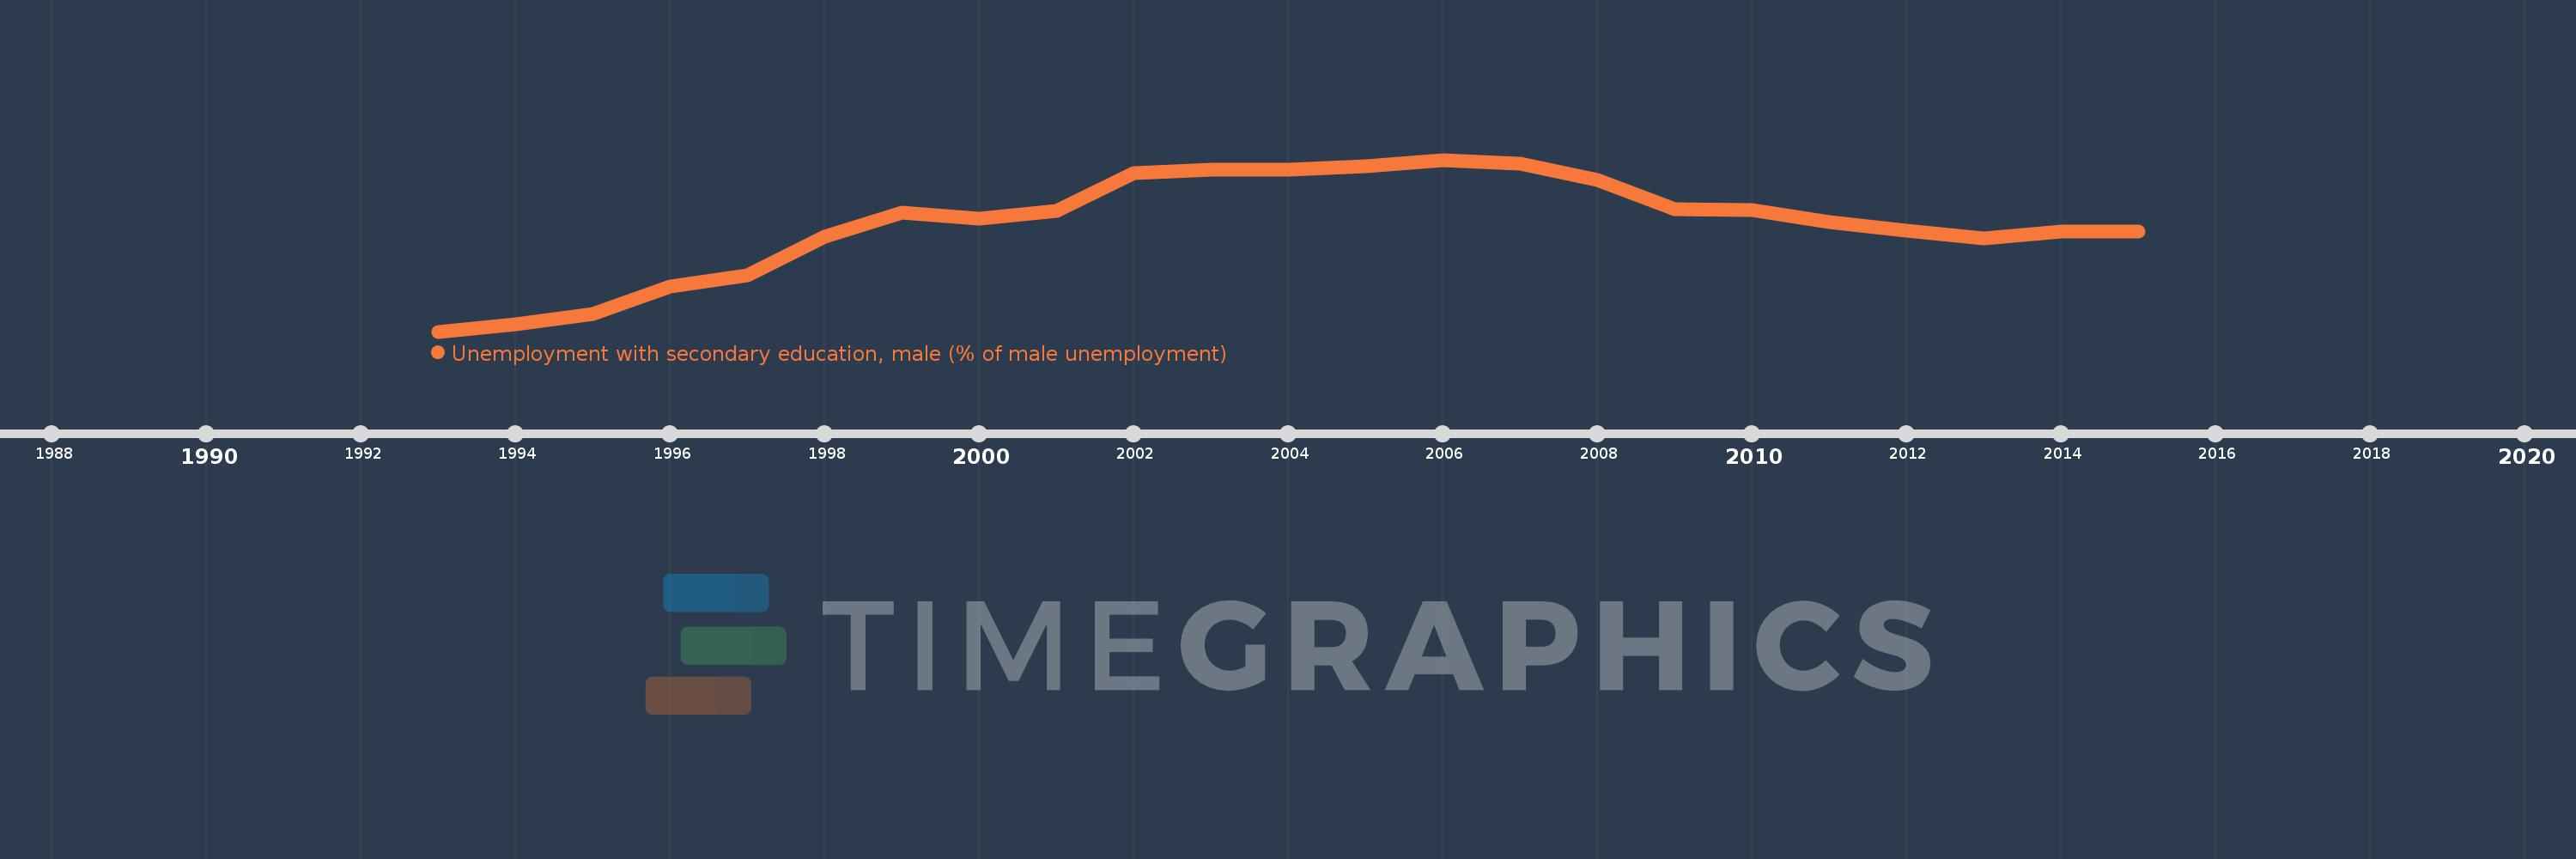
Unemployment with secondary education, male (% of male unemployment)
2015,2014,2013,2012,2011,2010,2009,2008,2007,2006,2005,2004,2003,2002,2001,2000,1999,1998,1997,1996,1995,1994,1993
Cette statistique dans les autres pays:
La ligne de temps
Cette échelle de temps montre un graphique de 1993 année à 2015 année Euro area. Les données jusqu'à 1992 année ne sont pas présentés. Quantité d'observations actuelles selon dates: 23.
Source (désignation):
Les indicateurs du développement mondiale
Source (organisation):
International Labour Organization, Key Indicators of the Labour Market database.
Catégories:
Social Protection & Labor, Gender
Dernière mise à jour
23 avr. 2017
Les indicateurs de changement de valeurs selon les années
Minimum:
31.417
1 janv. 1993
Maximum:
44.171
1 janv. 2006
Pour la date d''observation
Valeur
Changement absolu
Le changement par rapport à la valeur précédente
1 janv. 1993
31.417
+31.417
0.0%
1 janv. 1994
31.983
+0.566
1.8%
1 janv. 1995
32.702
+0.718
2.25%
1 janv. 1996
34.756
+2.054
6.28%
1 janv. 1997
35.589
+0.833
2.4%
1 janv. 1998
38.457
+2.868
8.06%
1 janv. 1999
40.272
+1.815
4.72%
1 janv. 2000
39.774
-0.498
-1.24%
1 janv. 2001
40.371
+0.597
1.5%
1 janv. 2002
43.177
+2.806
6.95%
1 janv. 2003
43.43
+0.253
0.59%
1 janv. 2004
43.451
+0.021
0.05%
1 janv. 2005
43.661
+0.21
0.48%
1 janv. 2006
44.171
+0.51
1.17%
1 janv. 2007
43.893
-0.278
-0.63%
1 janv. 2008
42.645
-1.248
-2.84%
1 janv. 2009
40.488
-2.156
-5.06%
1 janv. 2010
40.469
-0.019
-0.05%
1 janv. 2011
39.567
-0.902
-2.23%
1 janv. 2012
38.89
-0.678
-1.71%
1 janv. 2013
38.354
-0.535
-1.38%
1 janv. 2014
38.865
+0.511
1.33%
1 janv. 2015
38.842
-0.023
-0.06%
Classement des pays selon les statistiques actuelles par années


Commentaires: