29
/fr/
fr
AIzaSyAYiBZKx7MnpbEhh9jyipgxe19OcubqV5w
April 1, 2024
31220
Europe & Central Asia
ECS
false
2
1
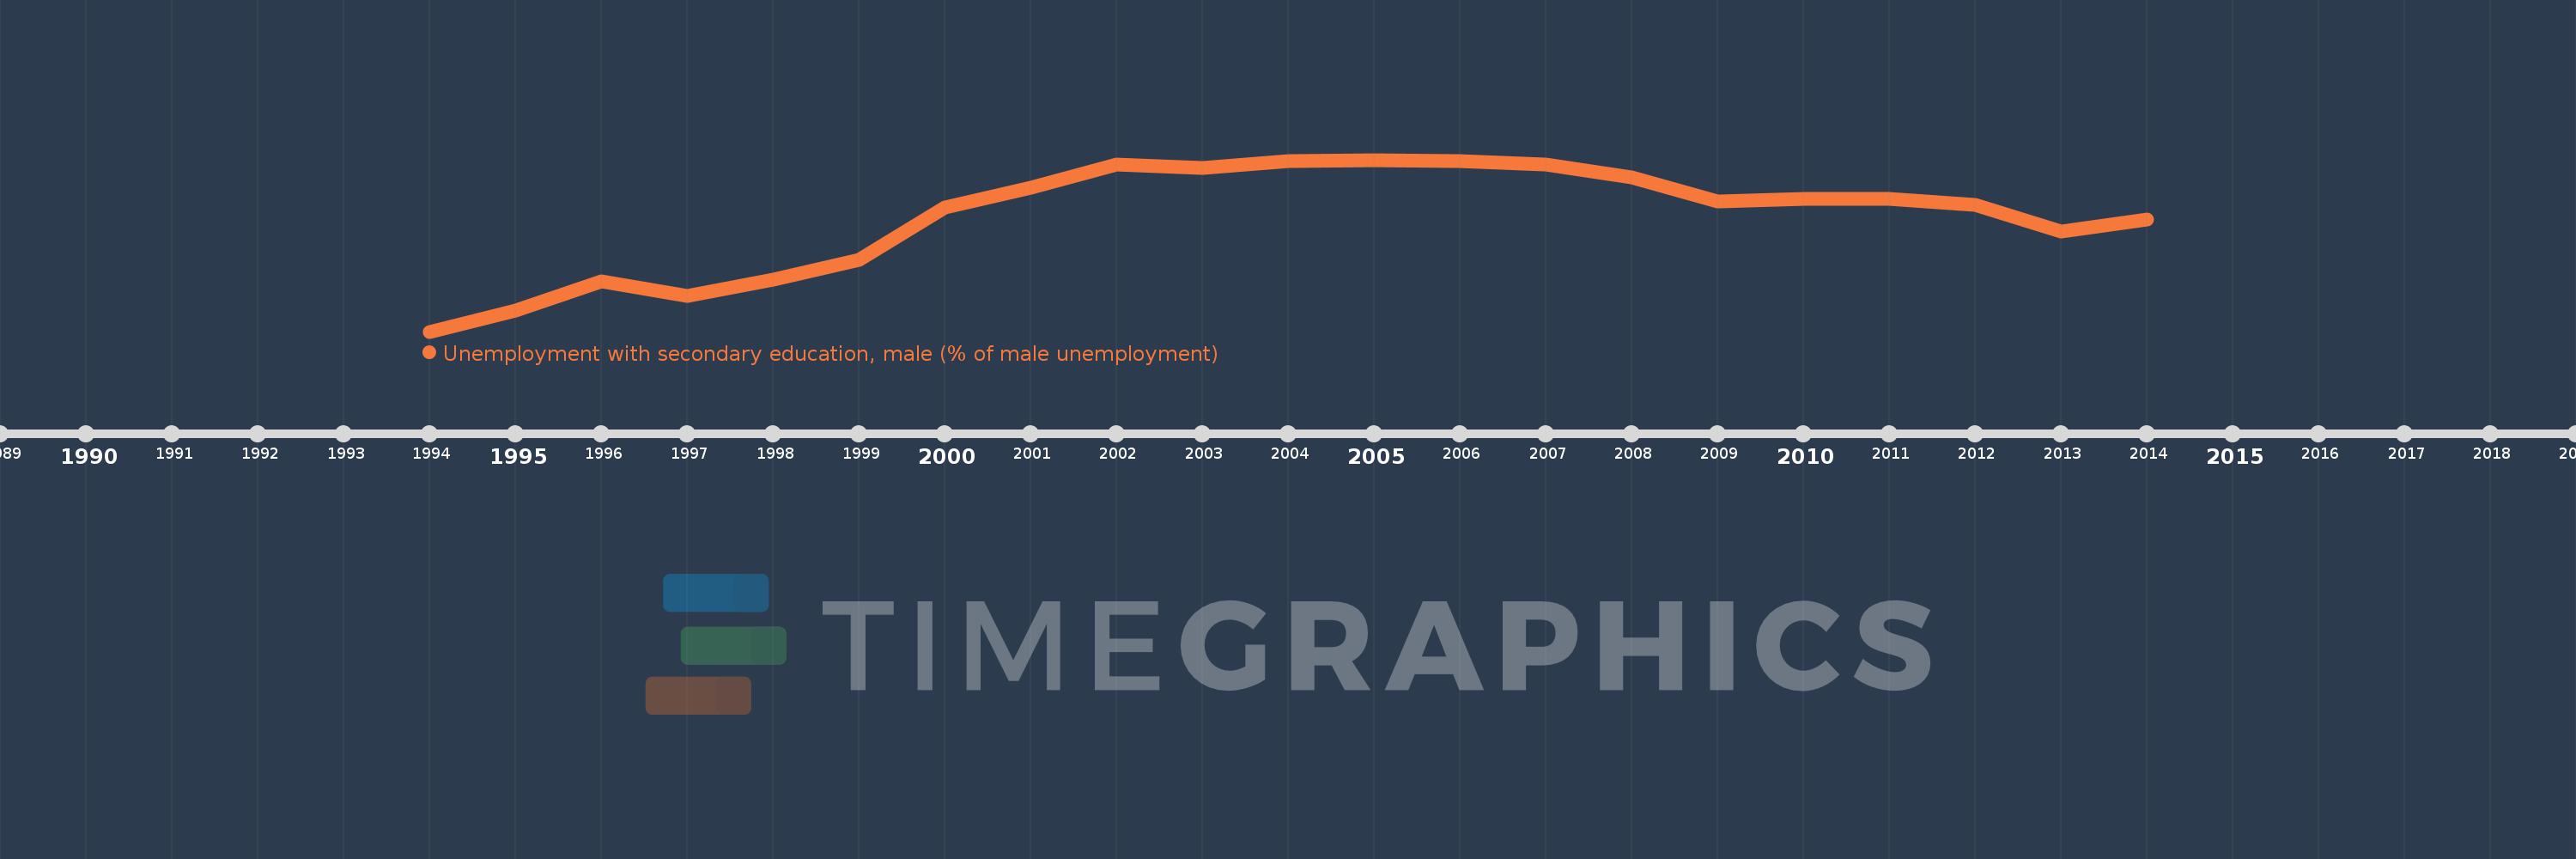
Unemployment with secondary education, male (% of male unemployment)
2014,2013,2012,2011,2010,2009,2008,2007,2006,2005,2004,2003,2002,2001,2000,1999,1998,1997,1996,1995,1994
Cette statistique dans les autres pays:
La ligne de temps
Cette échelle de temps montre un graphique de 1994 année à 2014 année Europe & Central Asia. Les données jusqu'à 1993 année ne sont pas présentés. Quantité d'observations actuelles selon dates: 21.
Source (désignation):
Les indicateurs du développement mondiale
Source (organisation):
International Labour Organization, Key Indicators of the Labour Market database.
Catégories:
Social Protection & Labor, Gender
Dernière mise à jour
23 avr. 2017
Les indicateurs de changement de valeurs selon les années
Minimum:
37.283
1 janv. 1994
Maximum:
50.335
1 janv. 2005
Pour la date d''observation
Valeur
Changement absolu
Le changement par rapport à la valeur précédente
1 janv. 1994
37.283
+37.283
0.0%
1 janv. 1995
38.883
+1.6
4.29%
1 janv. 1996
41.13
+2.246
5.78%
1 janv. 1997
39.971
-1.159
-2.82%
1 janv. 1998
41.225
+1.254
3.14%
1 janv. 1999
42.727
+1.502
3.64%
1 janv. 2000
46.705
+3.978
9.31%
1 janv. 2001
48.241
+1.536
3.29%
1 janv. 2002
49.998
+1.757
3.64%
1 janv. 2003
49.722
-0.276
-0.55%
1 janv. 2004
50.229
+0.507
1.02%
1 janv. 2005
50.335
+0.106
0.21%
1 janv. 2006
50.214
-0.121
-0.24%
1 janv. 2007
49.962
-0.252
-0.5%
1 janv. 2008
49.015
-0.947
-1.9%
1 janv. 2009
47.201
-1.814
-3.7%
1 janv. 2010
47.382
+0.181
0.38%
1 janv. 2011
47.391
+0.01
0.02%
1 janv. 2012
46.925
-0.467
-0.99%
1 janv. 2013
44.913
-2.011
-4.29%
1 janv. 2014
45.827
+0.913
2.03%
Classement des pays selon les statistiques actuelles par années


Commentaires: