29
/de/
de
AIzaSyAYiBZKx7MnpbEhh9jyipgxe19OcubqV5w
April 1, 2024
30380
Euro area
EMU
false
2
1
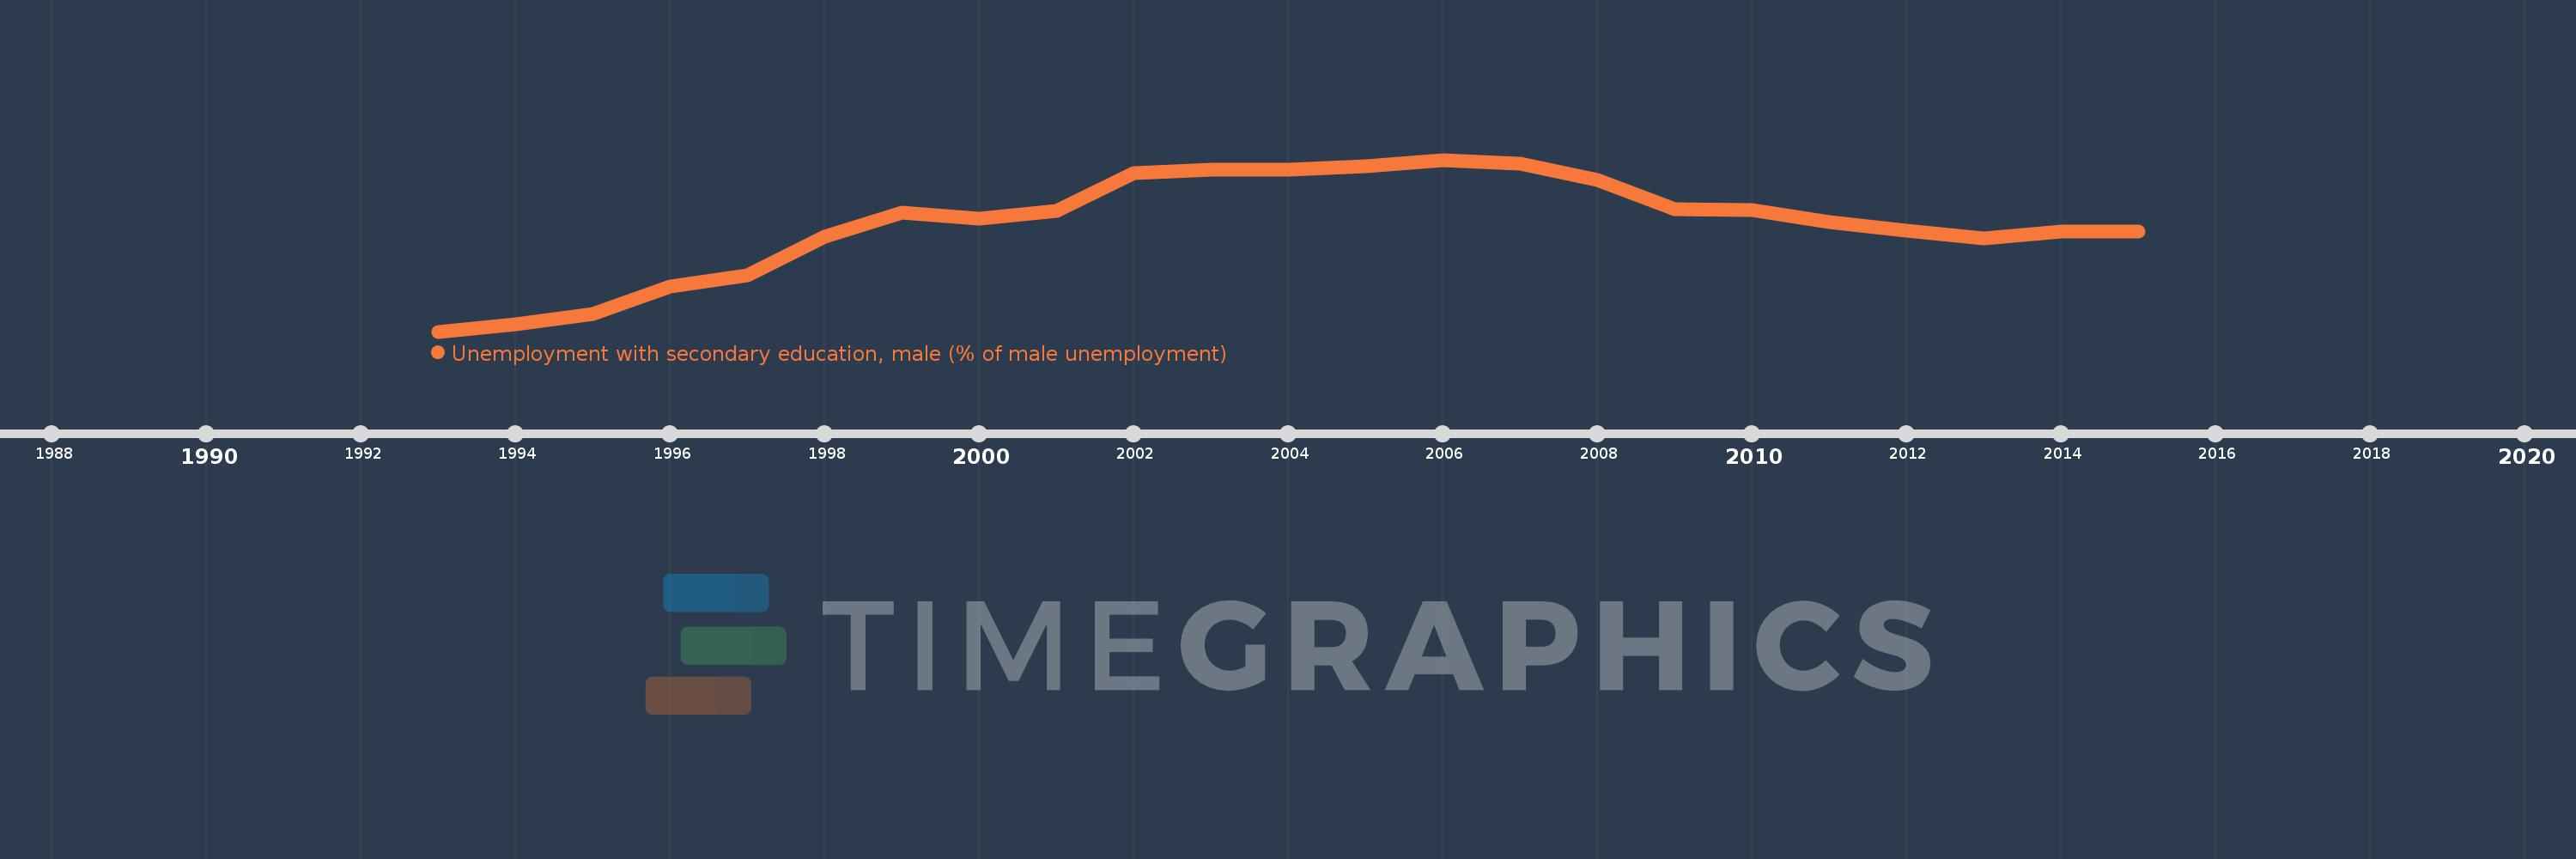
Unemployment with secondary education, male (% of male unemployment)
2015,2014,2013,2012,2011,2010,2009,2008,2007,2006,2005,2004,2003,2002,2001,2000,1999,1998,1997,1996,1995,1994,1993
Diese Statistik in anderen Ländern:
Zeitlinie:
Diese Zeitleiste vorliegt die Graphik ab 1993 J. bis 2015 J. Euro area. Die Angaben bis 1992 J. sind nicht vorhanden. Die Zahl aktueller Beobachtungen nach Daten: 23.
Die Quelle (Bezeichnung):
Kennzahlen der Weltentwicklung
Die Quelle (Einrichtung):
International Labour Organization, Key Indicators of the Labour Market database.
Kategorien:
Social Protection & Labor, Gender
Es wurde aktualisiert:
23 Apr 2017 Jahr
Kennzahlen der Wertänderungen vom Jahr zum Jahr
Minimum:
31.417
1 Jan 1993 Jahr
Maximum:
44.171
1 Jan 2006 Jahr
Zum Datum der Beobachtung
Wert
Absolute Veränderung
Die Veränderung bezüglich dem vorherigen Wert
1 Jan 1993 Jahr
31.417
+31.417
0.0%
1 Jan 1994 Jahr
31.983
+0.566
1.8%
1 Jan 1995 Jahr
32.702
+0.718
2.25%
1 Jan 1996 Jahr
34.756
+2.054
6.28%
1 Jan 1997 Jahr
35.589
+0.833
2.4%
1 Jan 1998 Jahr
38.457
+2.868
8.06%
1 Jan 1999 Jahr
40.272
+1.815
4.72%
1 Jan 2000 Jahr
39.774
-0.498
-1.24%
1 Jan 2001 Jahr
40.371
+0.597
1.5%
1 Jan 2002 Jahr
43.177
+2.806
6.95%
1 Jan 2003 Jahr
43.43
+0.253
0.59%
1 Jan 2004 Jahr
43.451
+0.021
0.05%
1 Jan 2005 Jahr
43.661
+0.21
0.48%
1 Jan 2006 Jahr
44.171
+0.51
1.17%
1 Jan 2007 Jahr
43.893
-0.278
-0.63%
1 Jan 2008 Jahr
42.645
-1.248
-2.84%
1 Jan 2009 Jahr
40.488
-2.156
-5.06%
1 Jan 2010 Jahr
40.469
-0.019
-0.05%
1 Jan 2011 Jahr
39.567
-0.902
-2.23%
1 Jan 2012 Jahr
38.89
-0.678
-1.71%
1 Jan 2013 Jahr
38.354
-0.535
-1.38%
1 Jan 2014 Jahr
38.865
+0.511
1.33%
1 Jan 2015 Jahr
38.842
-0.023
-0.06%
Bewertung der Länder gemäß mit laufender Statistik nach Jahren


Kommentare: