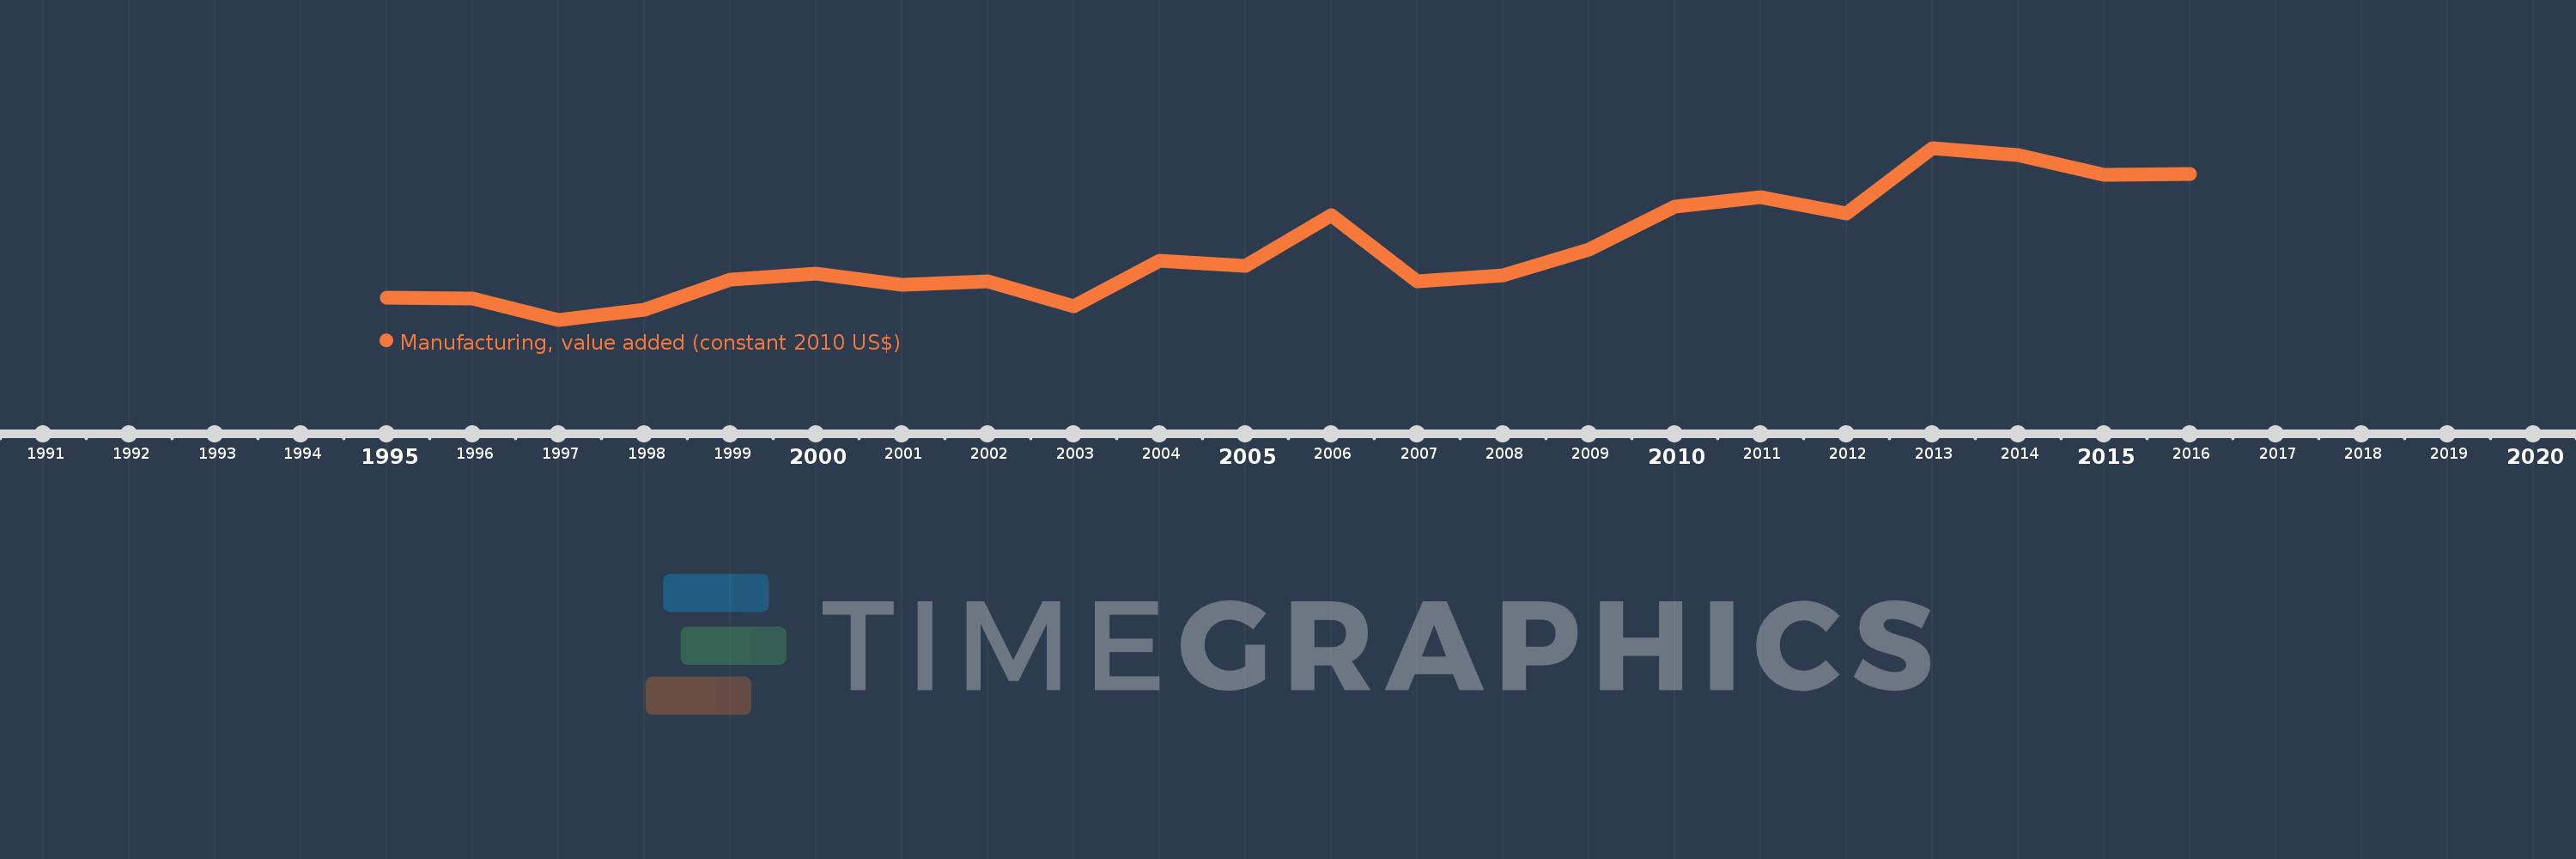
Cette échelle de temps montre un graphique de 1995 année à 2016 année West Bank and Gaza. Les données jusqu'à 1994 année ne sont pas présentés. Quantité d'observations actuelles selon dates: 22.
Source (désignation):
Les indicateurs du développement mondiale
Source (organisation):
World Bank national accounts data, and OECD National Accounts data files.
Catégories:
Economy & Growth
Dernière mise à jour
23 avr. 2017
Les indicateurs de changement de valeurs selon les années
En moyenne:
951.797 mln.
Minimum:
630.496 mln.
1 janv. 1997
Maximum:
1.406 mds
1 janv. 2013
Pour la date d''observation
Valeur
Changement absolu
Le changement par rapport à la valeur précédente
1 janv. 1995
731.205 mln.
+731.205 mln.
0.0%
1 janv. 1996
727.927 mln.
-3.278 mln.
-0.45%
1 janv. 1997
630.496 mln.
-97.43 mln.
-13.38%
1 janv. 1998
676.804 mln.
+46.308 mln.
7.34%
1 janv. 1999
811.32 mln.
+134.516 mln.
19.88%
1 janv. 2000
838.092 mln.
+26.772 mln.
3.3%
1 janv. 2001
788.757 mln.
-49.335 mln.
-5.89%
1 janv. 2002
804.476 mln.
+15.719 mln.
1.99%
1 janv. 2003
690.5 mln.
-113.976 mln.
-14.17%
1 janv. 2004
895.467 mln.
+204.967 mln.
29.68%
1 janv. 2005
874.932 mln.
-20.535 mln.
-2.29%
1 janv. 2006
1.1 mds
+225.495 mln.
25.77%
1 janv. 2007
802.179 mln.
-298.248 mln.
-27.1%
1 janv. 2008
831.022 mln.
+28.843 mln.
3.6%
1 janv. 2009
949.009 mln.
+117.987 mln.
14.2%
1 janv. 2010
1.141 mds
+191.545 mln.
20.18%
1 janv. 2011
1.184 mds
+43.446 mln.
3.81%
1 janv. 2012
1.109 mds
-75.009 mln.
-6.34%
1 janv. 2013
1.406 mds
+296.563 mln.
26.74%
1 janv. 2014
1.373 mds
-32.908 mln.
-2.34%
1 janv. 2015
1.286 mds
-86.582 mln.
-6.31%
1 janv. 2016
1.289 mds
+3.05 mln.
0.24%
Classement des pays selon les statistiques actuelles par années
