29
/fr/
fr
AIzaSyAYiBZKx7MnpbEhh9jyipgxe19OcubqV5w
April 1, 2024
144648
Guatemala
GTM
true
2
1
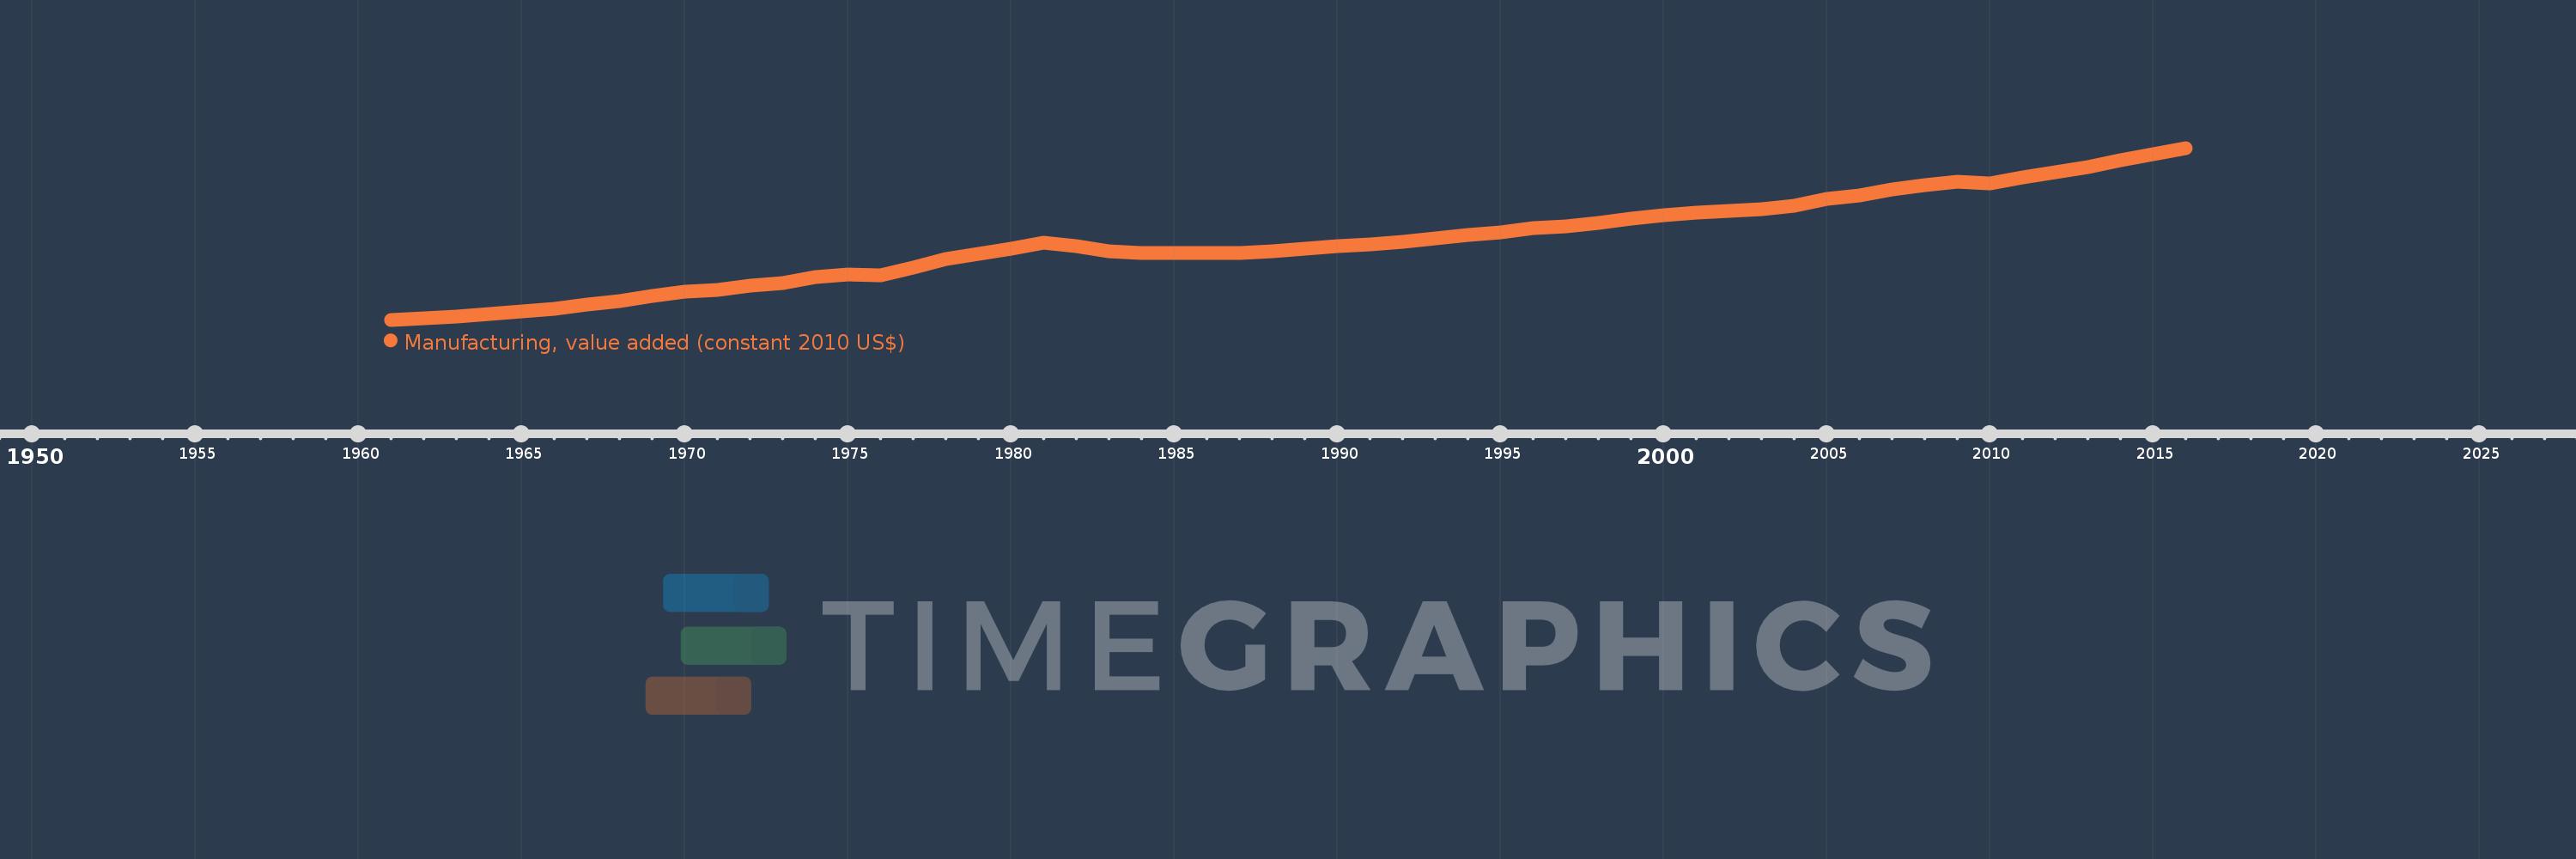
Manufacturing, value added (constant 2010 US$)
2016,2015,2014,2013,2012,2011,2010,2009,2008,2007,2006,2005,2004,2003,2002,2001,2000,1999,1998,1997,1996,1995,1994,1993,1992,1991,1990,1989,1988,1987,1986,1985,1984,1983,1982,1981,1980,1979,1978,1977,1976,1975,1974,1973,1972,1971,1970,1969,1968,1967,1966,1965,1964,1963,1962,1961
Cette statistique dans les autres pays:
AfghanistanAlbaniaAndorraAntigua and BarbudaArab WorldArgentinaArmeniaArubaAustraliaAustriaAzerbaijanBahamas, TheBahrainBangladeshBarbadosBelarusBelgiumBelizeBeninBermudaBhutanBoliviaBosnia and HerzegovinaBotswanaBrazilBrunei DarussalamBurkina FasoBurundiCambodiaCameroonCanadaCaribbean small statesCentral African RepublicCentral Europe and the BalticsChadChileChinaColombiaComorosCongo, Dem. Rep.Congo, Rep.Costa RicaCote d'IvoireCroatiaCubaCyprusCzech RepublicDenmarkDominicaDominican RepublicEarly-demographic dividendEast Asia & PacificEast Asia & Pacific (excluding high income)East Asia & Pacific (IDA & IBRD countries)EcuadorEgypt, Arab Rep.El SalvadorEquatorial GuineaEstoniaEthiopiaEuro areaEurope & Central AsiaEurope & Central Asia (excluding high income)Europe & Central Asia (IDA & IBRD countries)European UnionFaroe IslandsFijiFinlandFragile and conflict affected situationsFranceGabonGambia, TheGeorgiaGermanyGhanaGreeceGrenadaGuatemalaGuineaGuyanaHeavily indebted poor countries (HIPC)High incomeHondurasHong Kong SAR, ChinaHungaryIBRD onlyIcelandIDA & IBRD totalIDA blendIDA onlyIDA totalIndiaIndonesiaIran, Islamic Rep.IraqIrelandItalyJamaicaJapanJordanKazakhstanKenyaKiribatiKorea, Rep.KosovoKuwaitKyrgyz RepublicLao PDRLate-demographic dividendLatin America & Caribbean Latin America & Caribbean (excluding high income)Latin America & the Caribbean (IDA & IBRD countries)LatviaLeast developed countries: UN classificationLebanonLesothoLiberiaLithuaniaLow & middle incomeLow incomeLower middle incomeLuxembourgMacao SAR, ChinaMacedonia, FYRMalawiMalaysiaMaldivesMaltaMarshall IslandsMauritaniaMauritiusMexicoMicronesia, Fed. Sts.Middle East & North AfricaMiddle East & North Africa (excluding high income)Middle East & North Africa (IDA & IBRD countries)Middle incomeMoldovaMongoliaMontenegroMoroccoMozambiqueMyanmarNamibiaNepalNetherlandsNew ZealandNicaraguaNigerNigeriaNorth AmericaNorwayOECD membersOmanOther small statesPacific island small statesPakistanPalauPanamaParaguayPeruPhilippinesPolandPortugalPost-demographic dividendPre-demographic dividendPuerto RicoQatarRomaniaRussian FederationRwandaSamoaSao Tome and PrincipeSaudi ArabiaSenegalSerbiaSeychellesSierra LeoneSingaporeSlovak RepublicSloveniaSmall statesSouth AfricaSouth AsiaSouth Asia (IDA & IBRD)SpainSri LankaSt. Kitts and NevisSt. LuciaSt. Vincent and the GrenadinesSub-Saharan Africa Sub-Saharan Africa (excluding high income)Sub-Saharan Africa (IDA & IBRD countries)SudanSurinameSwazilandSwedenSwitzerlandTajikistanTanzaniaThailandTimor-LesteTogoTongaTrinidad and TobagoTunisiaTurkeyTuvaluUgandaUkraineUnited Arab EmiratesUnited KingdomUnited StatesUpper middle incomeUruguayUzbekistanVanuatuVenezuela, RBVietnamWest Bank and GazaWorldYemen, Rep.ZambiaZimbabwe La ligne de temps
Cette échelle de temps montre un graphique de 1961 année à 2016 année Guatemala. Les données jusqu'à 1960 année ne sont pas présentés. Quantité d'observations actuelles selon dates: 56.
Source (désignation):
Les indicateurs du développement mondiale
Source (organisation):
World Bank national accounts data, and OECD National Accounts data files.
Catégories:
Economy & Growth
Dernière mise à jour
23 avr. 2017
Les indicateurs de changement de valeurs selon les années
Minimum:
1.24 mds
1 janv. 1961
Maximum:
9.049 mds
1 janv. 2016
Pour la date d''observation
Valeur
Changement absolu
Le changement par rapport à la valeur précédente
1 janv. 1961
1.24 mds
+1.24 mds
0.0%
1 janv. 1962
1.311 mds
+71.374 mln.
5.76%
1 janv. 1963
1.383 mds
+71.374 mln.
5.44%
1 janv. 1964
1.51 mds
+127.192 mln.
9.2%
1 janv. 1965
1.614 mds
+104.316 mln.
6.91%
1 janv. 1966
1.746 mds
+131.774 mln.
8.16%
1 janv. 1967
1.928 mds
+182.096 mln.
10.43%
1 janv. 1968
2.091 mds
+162.88 mln.
8.45%
1 janv. 1969
2.332 mds
+240.66 mln.
11.51%
1 janv. 1970
2.501 mds
+169.285 mln.
7.26%
1 janv. 1971
2.59 mds
+88.76 mln.
3.55%
1 janv. 1972
2.774 mds
+184.841 mln.
7.14%
1 janv. 1973
2.926 mds
+151.899 mln.
5.47%
1 janv. 1974
3.164 mds
+237.914 mln.
8.13%
1 janv. 1975
3.309 mds
+144.579 mln.
4.57%
1 janv. 1976
3.26 mds
-48.498 mln.
-1.47%
1 janv. 1977
3.601 mds
+340.401 mln.
10.44%
1 janv. 1978
3.986 mds
+385.238 mln.
10.7%
1 janv. 1979
4.243 mds
+257.131 mln.
6.45%
1 janv. 1980
4.48 mds
+236.999 mln.
5.59%
1 janv. 1981
4.734 mds
+253.47 mln.
5.66%
1 janv. 1982
4.586 mds
-147.324 mln.
-3.11%
1 janv. 1983
4.347 mds
-238.829 mln.
-5.21%
1 janv. 1984
4.264 mds
-83.27 mln.
-1.92%
1 janv. 1985
4.286 mds
+21.961 mln.
0.52%
1 janv. 1986
4.255 mds
-31.112 mln.
-0.73%
1 janv. 1987
4.282 mds
+26.537 mln.
0.62%
1 janv. 1988
4.368 mds
+86.93 mln.
2.03%
1 janv. 1989
4.465 mds
+96.081 mln.
2.2%
1 janv. 1990
4.567 mds
+102.486 mln.
2.3%
1 janv. 1991
4.668 mds
+101.282 mln.
2.22%
1 janv. 1992
4.779 mds
+110.58 mln.
2.37%
1 janv. 1993
4.936 mds
+156.675 mln.
3.28%
1 janv. 1994
5.078 mds
+142.854 mln.
2.89%
1 janv. 1995
5.228 mds
+149.829 mln.
2.95%
1 janv. 1996
5.398 mds
+169.917 mln.
3.25%
1 janv. 1997
5.501 mds
+102.564 mln.
1.9%
1 janv. 1998
5.649 mds
+148.518 mln.
2.7%
1 janv. 1999
5.854 mds
+204.94 mln.
3.63%
1 janv. 2000
6.003 mds
+148.891 mln.
2.54%
1 janv. 2001
6.115 mds
+111.658 mln.
1.86%
1 janv. 2002
6.182 mds
+67.067 mln.
1.1%
1 janv. 2003
6.252 mds
+70.504 mln.
1.14%
1 janv. 2004
6.409 mds
+156.472 mln.
2.5%
1 janv. 2005
6.722 mds
+313.621 mln.
4.89%
1 janv. 2006
6.897 mds
+175.056 mln.
2.6%
1 janv. 2007
7.157 mds
+259.173 mln.
3.76%
1 janv. 2008
7.374 mds
+217.764 mln.
3.04%
1 janv. 2009
7.523 mds
+148.16 mln.
2.01%
1 janv. 2010
7.454 mds
-68.576 mln.
-0.91%
1 janv. 2011
7.704 mds
+249.525 mln.
3.35%
1 janv. 2012
7.937 mds
+233.537 mln.
3.03%
1 janv. 2013
8.197 mds
+259.998 mln.
3.28%
1 janv. 2014
8.48 mds
+283.135 mln.
3.45%
1 janv. 2015
8.747 mds
+267.205 mln.
3.15%
1 janv. 2016
9.049 mds
+302.037 mln.
3.45%
Classement des pays selon les statistiques actuelles par années


Commentaires: