29
/fr/
fr
AIzaSyAYiBZKx7MnpbEhh9jyipgxe19OcubqV5w
April 1, 2024
115997
Cuba
CUB
true
2
1
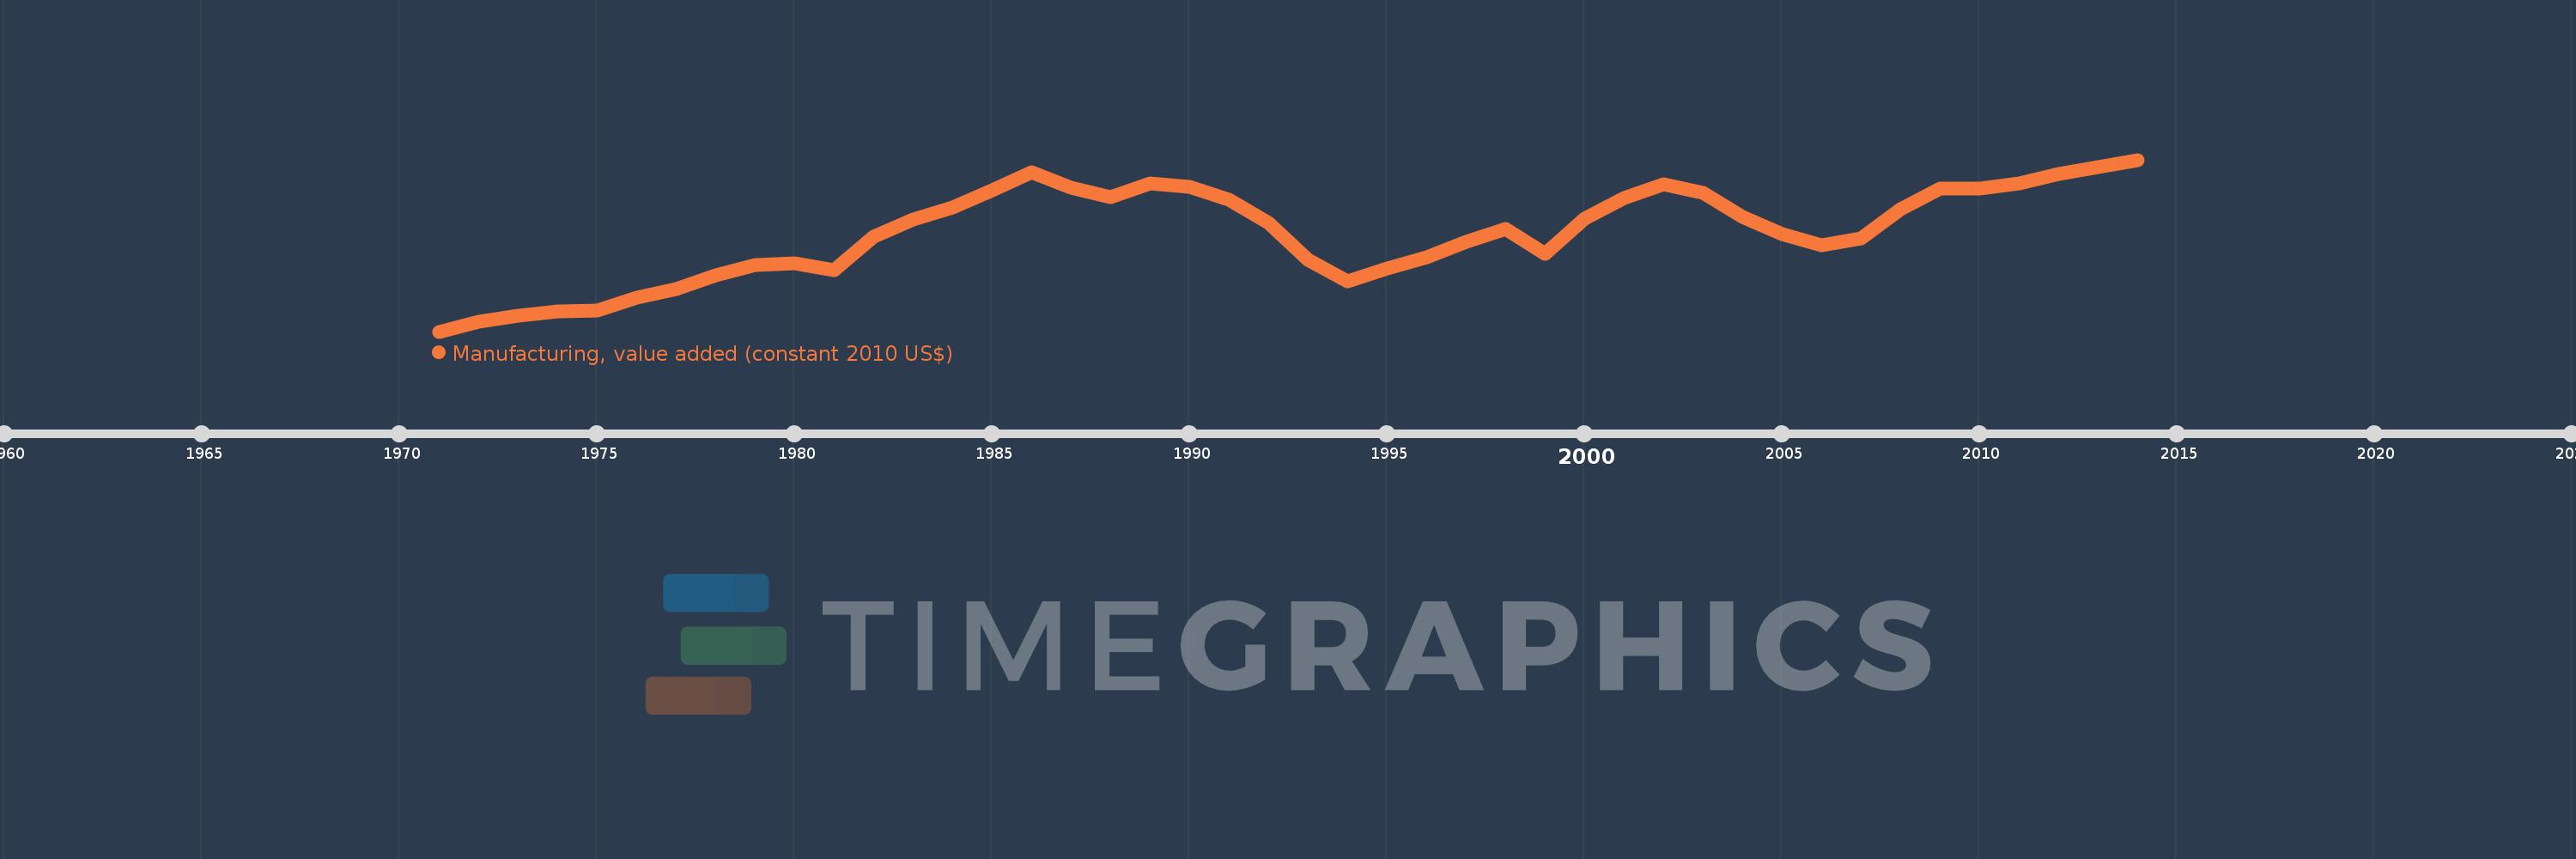
Manufacturing, value added (constant 2010 US$)
2014,2013,2012,2011,2010,2009,2008,2007,2006,2005,2004,2003,2002,2001,2000,1999,1998,1997,1996,1995,1994,1993,1992,1991,1990,1989,1988,1987,1986,1985,1984,1983,1982,1981,1980,1979,1978,1977,1976,1975,1974,1973,1972,1971
Cette statistique dans les autres pays:
AfghanistanAlbaniaAndorraAntigua and BarbudaArab WorldArgentinaArmeniaArubaAustraliaAustriaAzerbaijanBahamas, TheBahrainBangladeshBarbadosBelarusBelgiumBelizeBeninBermudaBhutanBoliviaBosnia and HerzegovinaBotswanaBrazilBrunei DarussalamBurkina FasoBurundiCambodiaCameroonCanadaCaribbean small statesCentral African RepublicCentral Europe and the BalticsChadChileChinaColombiaComorosCongo, Dem. Rep.Congo, Rep.Costa RicaCote d'IvoireCroatiaCubaCyprusCzech RepublicDenmarkDominicaDominican RepublicEarly-demographic dividendEast Asia & PacificEast Asia & Pacific (excluding high income)East Asia & Pacific (IDA & IBRD countries)EcuadorEgypt, Arab Rep.El SalvadorEquatorial GuineaEstoniaEthiopiaEuro areaEurope & Central AsiaEurope & Central Asia (excluding high income)Europe & Central Asia (IDA & IBRD countries)European UnionFaroe IslandsFijiFinlandFragile and conflict affected situationsFranceGabonGambia, TheGeorgiaGermanyGhanaGreeceGrenadaGuatemalaGuineaGuyanaHeavily indebted poor countries (HIPC)High incomeHondurasHong Kong SAR, ChinaHungaryIBRD onlyIcelandIDA & IBRD totalIDA blendIDA onlyIDA totalIndiaIndonesiaIran, Islamic Rep.IraqIrelandItalyJamaicaJapanJordanKazakhstanKenyaKiribatiKorea, Rep.KosovoKuwaitKyrgyz RepublicLao PDRLate-demographic dividendLatin America & Caribbean Latin America & Caribbean (excluding high income)Latin America & the Caribbean (IDA & IBRD countries)LatviaLeast developed countries: UN classificationLebanonLesothoLiberiaLithuaniaLow & middle incomeLow incomeLower middle incomeLuxembourgMacao SAR, ChinaMacedonia, FYRMalawiMalaysiaMaldivesMaltaMarshall IslandsMauritaniaMauritiusMexicoMicronesia, Fed. Sts.Middle East & North AfricaMiddle East & North Africa (excluding high income)Middle East & North Africa (IDA & IBRD countries)Middle incomeMoldovaMongoliaMontenegroMoroccoMozambiqueMyanmarNamibiaNepalNetherlandsNew ZealandNicaraguaNigerNigeriaNorth AmericaNorwayOECD membersOmanOther small statesPacific island small statesPakistanPalauPanamaParaguayPeruPhilippinesPolandPortugalPost-demographic dividendPre-demographic dividendPuerto RicoQatarRomaniaRussian FederationRwandaSamoaSao Tome and PrincipeSaudi ArabiaSenegalSerbiaSeychellesSierra LeoneSingaporeSlovak RepublicSloveniaSmall statesSouth AfricaSouth AsiaSouth Asia (IDA & IBRD)SpainSri LankaSt. Kitts and NevisSt. LuciaSt. Vincent and the GrenadinesSub-Saharan Africa Sub-Saharan Africa (excluding high income)Sub-Saharan Africa (IDA & IBRD countries)SudanSurinameSwazilandSwedenSwitzerlandTajikistanTanzaniaThailandTimor-LesteTogoTongaTrinidad and TobagoTunisiaTurkeyTuvaluUgandaUkraineUnited Arab EmiratesUnited KingdomUnited StatesUpper middle incomeUruguayUzbekistanVanuatuVenezuela, RBVietnamWest Bank and GazaWorldYemen, Rep.ZambiaZimbabwe La ligne de temps
Cette échelle de temps montre un graphique de 1971 année à 2014 année Cuba. Les données jusqu'à 1970 année ne sont pas présentés. Quantité d'observations actuelles selon dates: 44.
Source (désignation):
Les indicateurs du développement mondiale
Source (organisation):
World Bank national accounts data, and OECD National Accounts data files.
Catégories:
Economy & Growth
Dernière mise à jour
23 avr. 2017
Les indicateurs de changement de valeurs selon les années
Minimum:
2.445 mds
1 janv. 1971
Maximum:
6.139 mds
1 janv. 2014
Pour la date d''observation
Valeur
Changement absolu
Le changement par rapport à la valeur précédente
1 janv. 1971
2.445 mds
+2.445 mds
0.0%
1 janv. 1972
2.655 mds
+210.142 mln.
8.59%
1 janv. 1973
2.783 mds
+128.057 mln.
4.82%
1 janv. 1974
2.878 mds
+95.081 mln.
3.42%
1 janv. 1975
2.905 mds
+27.2 mln.
0.95%
1 janv. 1976
3.184 mds
+278.317 mln.
9.58%
1 janv. 1977
3.357 mds
+173.389 mln.
5.45%
1 janv. 1978
3.647 mds
+289.778 mln.
8.63%
1 janv. 1979
3.884 mds
+237.123 mln.
6.5%
1 janv. 1980
3.921 mds
+36.503 mln.
0.94%
1 janv. 1981
3.759 mds
-161.764 mln.
-4.13%
1 janv. 1982
4.482 mds
+723.652 mln.
19.25%
1 janv. 1983
4.857 mds
+374.619 mln.
8.36%
1 janv. 1984
5.111 mds
+254.062 mln.
5.23%
1 janv. 1985
5.492 mds
+380.953 mln.
7.45%
1 janv. 1986
5.877 mds
+385.405 mln.
7.02%
1 janv. 1987
5.545 mds
-332.195 mln.
-5.65%
1 janv. 1988
5.343 mds
-202.711 mln.
-3.66%
1 janv. 1989
5.629 mds
+286.642 mln.
5.37%
1 janv. 1990
5.565 mds
-64.002 mln.
-1.14%
1 janv. 1991
5.284 mds
-280.834 mln.
-5.05%
1 janv. 1992
4.783 mds
-501.652 mln.
-9.49%
1 janv. 1993
3.993 mds
-789.433 mln.
-16.51%
1 janv. 1994
3.534 mds
-458.832 mln.
-11.49%
1 janv. 1995
3.804 mds
+269.901 mln.
7.64%
1 janv. 1996
4.049 mds
+244.392 mln.
6.42%
1 janv. 1997
4.368 mds
+319.099 mln.
7.88%
1 janv. 1998
4.657 mds
+289.1 mln.
6.62%
1 janv. 1999
4.117 mds
-540.032 mln.
-11.6%
1 janv. 2000
4.881 mds
+763.841 mln.
18.55%
1 janv. 2001
5.318 mds
+437.061 mln.
8.95%
1 janv. 2002
5.618 mds
+300.144 mln.
5.64%
1 janv. 2003
5.435 mds
-182.88 mln.
-3.26%
1 janv. 2004
4.904 mds
-530.775 mln.
-9.77%
1 janv. 2005
4.538 mds
-366.41 mln.
-7.47%
1 janv. 2006
4.296 mds
-241.837 mln.
-5.33%
1 janv. 2007
4.445 mds
+148.935 mln.
3.47%
1 janv. 2008
5.072 mds
+626.6 mln.
14.1%
1 janv. 2009
5.521 mds
+449.567 mln.
8.86%
1 janv. 2010
5.515 mds
-6.009 mln.
-0.11%
1 janv. 2011
5.622 mds
+107.068 mln.
1.94%
1 janv. 2012
5.827 mds
+204.665 mln.
3.64%
1 janv. 2013
5.979 mds
+152.018 mln.
2.61%
1 janv. 2014
6.139 mds
+160.171 mln.
2.68%
Classement des pays selon les statistiques actuelles par années


Commentaires: