29
/fr/
fr
AIzaSyAYiBZKx7MnpbEhh9jyipgxe19OcubqV5w
April 1, 2024
264561
Togo
TGO
true
2
1
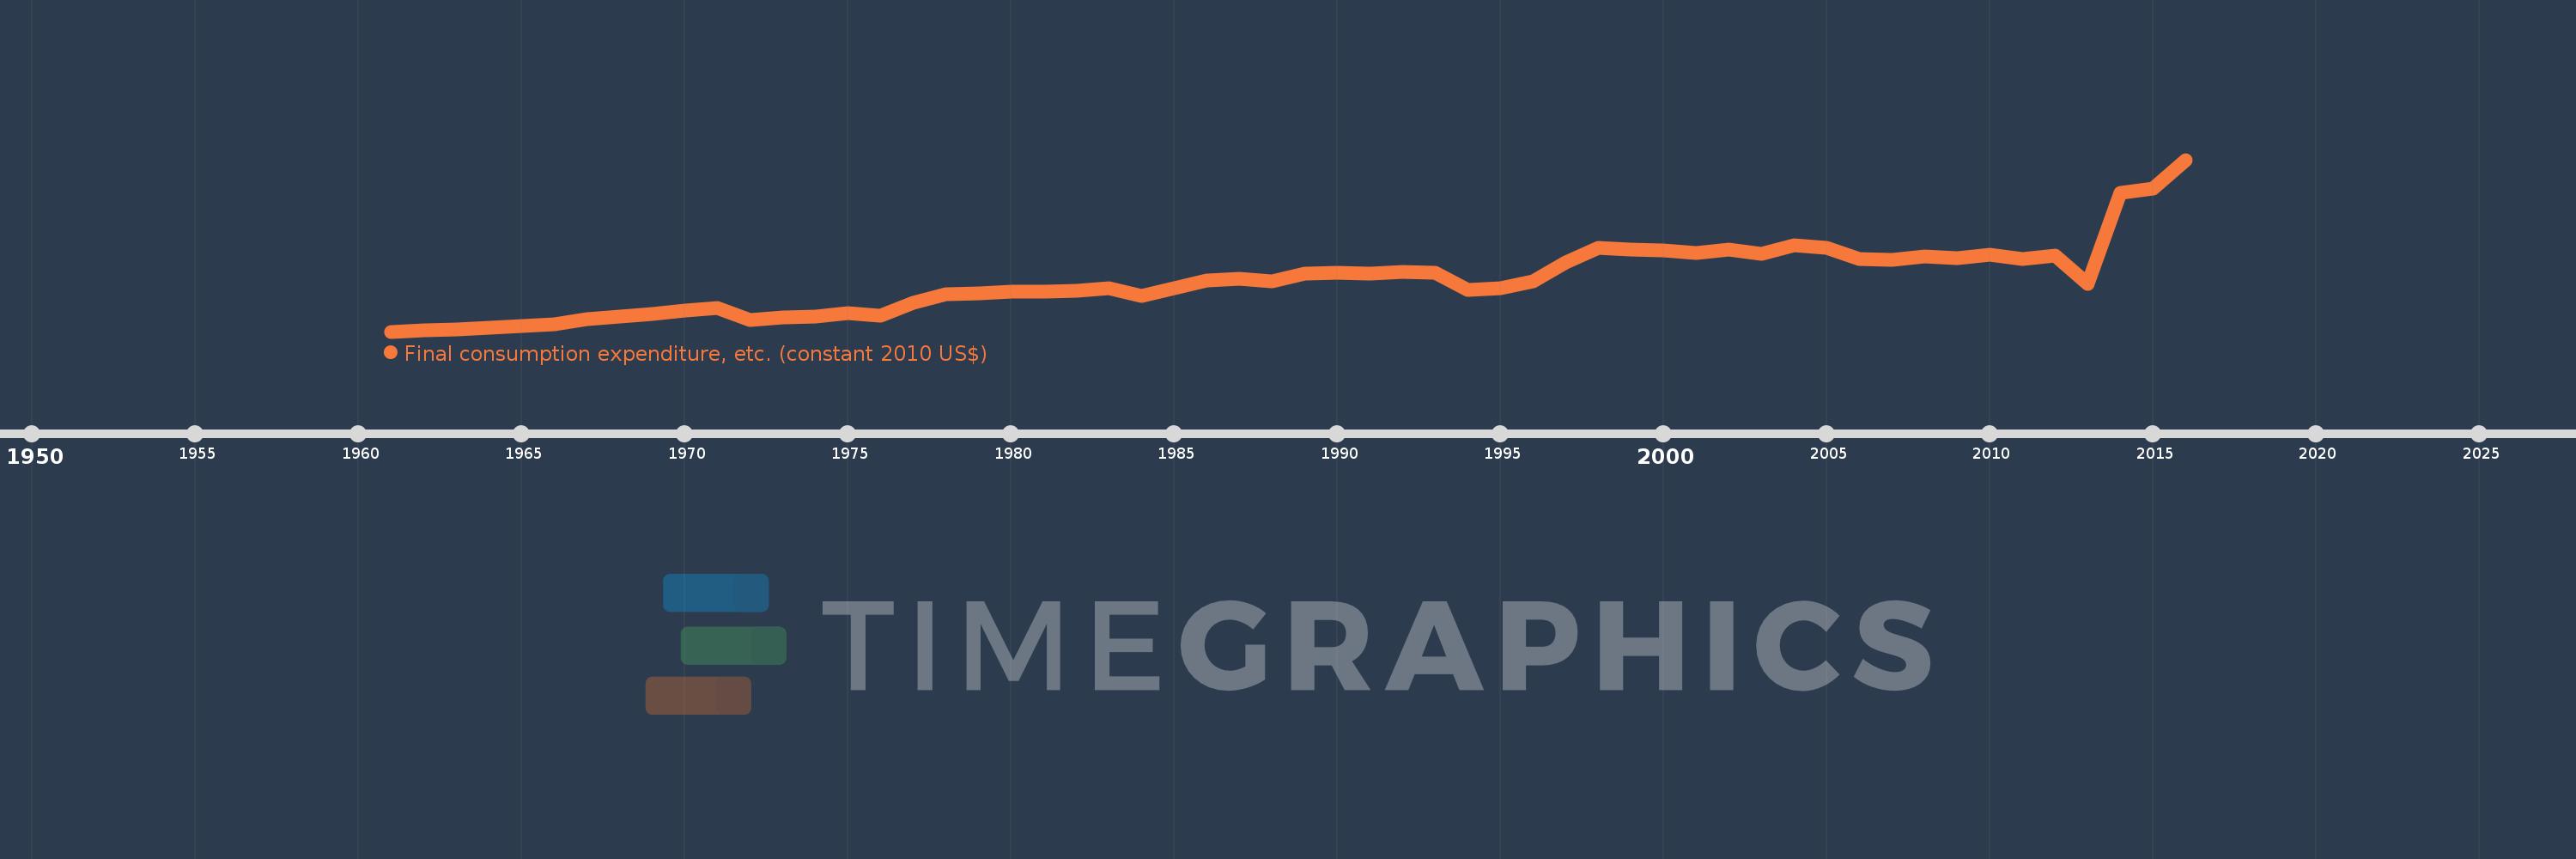
Final consumption expenditure, etc. (constant 2010 US$)
2016,2015,2014,2013,2012,2011,2010,2009,2008,2007,2006,2005,2004,2003,2002,2001,2000,1999,1998,1997,1996,1995,1994,1993,1992,1991,1990,1989,1988,1987,1986,1985,1984,1983,1982,1981,1980,1979,1978,1977,1976,1975,1974,1973,1972,1971,1970,1969,1968,1967,1966,1965,1964,1963,1962,1961
Cette statistique dans les autres pays:
AfghanistanAlbaniaAlgeriaAngolaAntigua and BarbudaArab WorldArgentinaArmeniaArubaAustraliaAustriaAzerbaijanBahamas, TheBahrainBangladeshBarbadosBelarusBelgiumBelizeBeninBermudaBhutanBoliviaBosnia and HerzegovinaBotswanaBrazilBrunei DarussalamBulgariaBurkina FasoBurundiCabo VerdeCambodiaCameroonCanadaCaribbean small statesCentral African RepublicCentral Europe and the BalticsChadChileChinaColombiaComorosCongo, Dem. Rep.Congo, Rep.Cote d'IvoireCroatiaCubaCyprusCzech RepublicDenmarkDominicaDominican RepublicEarly-demographic dividendEast Asia & PacificEast Asia & Pacific (excluding high income)East Asia & Pacific (IDA & IBRD countries)EcuadorEgypt, Arab Rep.El SalvadorEquatorial GuineaEritreaEstoniaEuro areaEurope & Central AsiaEurope & Central Asia (excluding high income)Europe & Central Asia (IDA & IBRD countries)European UnionFaroe IslandsFinlandFragile and conflict affected situationsFranceGabonGambia, TheGeorgiaGermanyGhanaGreeceGrenadaGuatemalaGuineaGuinea-BissauGuyanaHaitiHeavily indebted poor countries (HIPC)High incomeHondurasHong Kong SAR, ChinaHungaryIBRD onlyIcelandIDA & IBRD totalIDA blendIDA onlyIDA totalIndiaIndonesiaIran, Islamic Rep.IraqIrelandIsraelItalyJamaicaJapanJordanKazakhstanKenyaKorea, Rep.KosovoKuwaitKyrgyz RepublicLao PDRLate-demographic dividendLatin America & Caribbean Latin America & Caribbean (excluding high income)Latin America & the Caribbean (IDA & IBRD countries)LatviaLeast developed countries: UN classificationLebanonLiberiaLithuaniaLow & middle incomeLow incomeLower middle incomeLuxembourgMacao SAR, ChinaMacedonia, FYRMadagascarMalawiMalaysiaMaliMaltaMauritaniaMauritiusMexicoMiddle East & North AfricaMiddle East & North Africa (excluding high income)Middle East & North Africa (IDA & IBRD countries)Middle incomeMoldovaMongoliaMontenegroMoroccoMozambiqueNamibiaNepalNetherlandsNew ZealandNicaraguaNigerNigeriaNorth AmericaNorwayOECD membersOmanOther small statesPakistanPanamaParaguayPeruPhilippinesPolandPortugalPost-demographic dividendPre-demographic dividendPuerto RicoQatarRomaniaRussian FederationRwandaSaudi ArabiaSenegalSerbiaSeychellesSierra LeoneSingaporeSlovak RepublicSloveniaSmall statesSouth AfricaSouth AsiaSouth Asia (IDA & IBRD)South SudanSpainSri LankaSt. Kitts and NevisSt. LuciaSt. Vincent and the GrenadinesSub-Saharan Africa Sub-Saharan Africa (excluding high income)Sub-Saharan Africa (IDA & IBRD countries)SudanSurinameSwazilandSwedenSwitzerlandTajikistanTanzaniaThailandTimor-LesteTogoTongaTrinidad and TobagoTunisiaTurkeyTurkmenistanUgandaUkraineUnited Arab EmiratesUnited KingdomUnited StatesUpper middle incomeUruguayUzbekistanVanuatuVenezuela, RBVietnamWest Bank and GazaWorldYemen, Rep.ZambiaZimbabwe La ligne de temps
Cette échelle de temps montre un graphique de 1961 année à 2016 année Togo. Les données jusqu'à 1960 année ne sont pas présentés. Quantité d'observations actuelles selon dates: 56.
Source (désignation):
Les indicateurs du développement mondiale
Source (organisation):
World Bank national accounts data, and OECD National Accounts data files.
Catégories:
Economy & Growth
Dernière mise à jour
23 avr. 2017
Les indicateurs de changement de valeurs selon les années
Minimum:
761.333 mln.
1 janv. 1961
Maximum:
6.31 mds
1 janv. 2016
Pour la date d''observation
Valeur
Changement absolu
Le changement par rapport à la valeur précédente
1 janv. 1961
761.333 mln.
+761.333 mln.
0.0%
1 janv. 1962
815.79 mln.
+54.457 mln.
7.15%
1 janv. 1963
823.56 mln.
+7.769 mln.
0.95%
1 janv. 1964
894.937 mln.
+71.377 mln.
8.67%
1 janv. 1965
936.358 mln.
+41.422 mln.
4.63%
1 janv. 1966
989.879 mln.
+53.521 mln.
5.72%
1 janv. 1967
1.162 mds
+171.883 mln.
17.36%
1 janv. 1968
1.246 mds
+84.682 mln.
7.29%
1 janv. 1969
1.335 mds
+88.759 mln.
7.12%
1 janv. 1970
1.445 mds
+110.187 mln.
8.25%
1 janv. 1971
1.525 mds
+79.539 mln.
5.5%
1 janv. 1972
1.129 mds
-396.262 mln.
-25.99%
1 janv. 1973
1.211 mds
+81.865 mln.
7.25%
1 janv. 1974
1.253 mds
+42.938 mln.
3.55%
1 janv. 1975
1.357 mds
+103.659 mln.
8.27%
1 janv. 1976
1.275 mds
-82.114 mln.
-6.05%
1 janv. 1977
1.703 mds
+428.461 mln.
33.6%
1 janv. 1978
1.96 mds
+256.414 mln.
15.05%
1 janv. 1979
2.007 mds
+46.731 mln.
2.38%
1 janv. 1980
2.045 mds
+37.938 mln.
1.89%
1 janv. 1981
2.055 mds
+10.001 mln.
0.49%
1 janv. 1982
2.071 mds
+16.181 mln.
0.79%
1 janv. 1983
2.155 mds
+84.475 mln.
4.08%
1 janv. 1984
1.918 mds
-237.029 mln.
-11.0%
1 janv. 1985
2.158 mds
+239.356 mln.
12.48%
1 janv. 1986
2.424 mds
+266.475 mln.
12.35%
1 janv. 1987
2.48 mds
+56.415 mln.
2.33%
1 janv. 1988
2.381 mds
-99.783 mln.
-4.02%
1 janv. 1989
2.63 mds
+248.878 mln.
10.45%
1 janv. 1990
2.661 mds
+31.038 mln.
1.18%
1 janv. 1991
2.641 mds
-19.338 mln.
-0.73%
1 janv. 1992
2.688 mds
+46.374 mln.
1.76%
1 janv. 1993
2.657 mds
-30.863 mln.
-1.15%
1 janv. 1994
2.098 mds
-558.387 mln.
-21.02%
1 janv. 1995
2.163 mds
+65.141 mln.
3.1%
1 janv. 1996
2.392 mds
+228.359 mln.
10.56%
1 janv. 1997
2.996 mds
+603.984 mln.
25.25%
1 janv. 1998
3.454 mds
+458.278 mln.
15.3%
1 janv. 1999
3.41 mds
-44.418 mln.
-1.29%
1 janv. 2000
3.385 mds
-25.156 mln.
-0.74%
1 janv. 2001
3.307 mds
-77.445 mln.
-2.29%
1 janv. 2002
3.413 mds
+105.941 mln.
3.2%
1 janv. 2003
3.269 mds
-143.989 mln.
-4.22%
1 janv. 2004
3.546 mds
+277.232 mln.
8.48%
1 janv. 2005
3.474 mds
-71.913 mln.
-2.03%
1 janv. 2006
3.106 mds
-368.776 mln.
-10.61%
1 janv. 2007
3.08 mds
-25.846 mln.
-0.83%
1 janv. 2008
3.181 mds
+100.799 mln.
3.27%
1 janv. 2009
3.144 mds
-36.52 mln.
-1.15%
1 janv. 2010
3.237 mds
+93.214 mln.
2.96%
1 janv. 2011
3.116 mds
-120.952 mln.
-3.74%
1 janv. 2012
3.219 mds
+102.43 mln.
3.29%
1 janv. 2013
2.306 mds
-912.367 mln.
-28.35%
1 janv. 2014
5.239 mds
+2.932 mds
127.15%
1 janv. 2015
5.394 mds
+154.822 mln.
2.96%
1 janv. 2016
6.31 mds
+916.226 mln.
16.99%
Classement des pays selon les statistiques actuelles par années


Commentaires: