29
/fr/
fr
AIzaSyAYiBZKx7MnpbEhh9jyipgxe19OcubqV5w
April 1, 2024
127315
Equatorial Guinea
GNQ
true
2
1
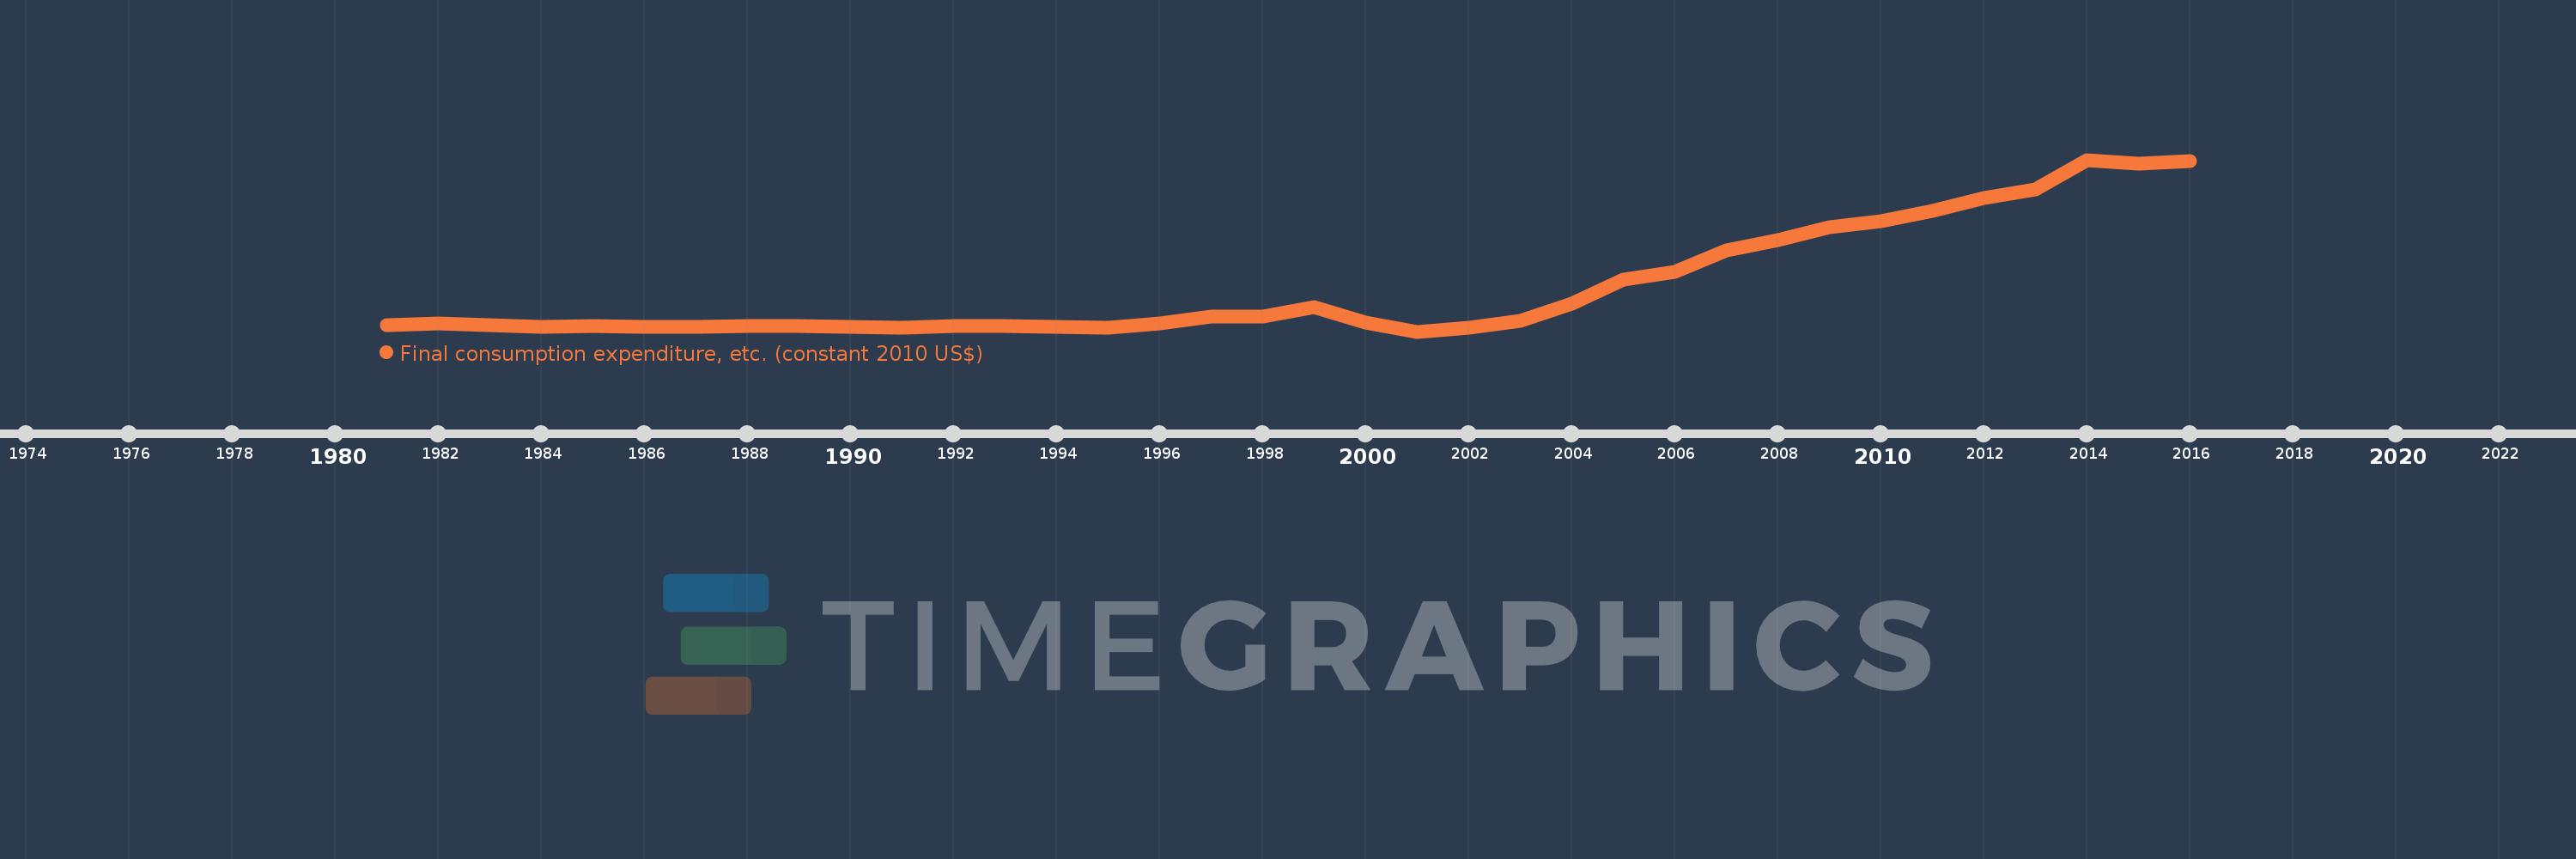
Final consumption expenditure, etc. (constant 2010 US$)
2016,2015,2014,2013,2012,2011,2010,2009,2008,2007,2006,2005,2004,2003,2002,2001,2000,1999,1998,1997,1996,1995,1994,1993,1992,1991,1990,1989,1988,1987,1986,1985,1984,1983,1982,1981
Cette statistique dans les autres pays:
AfghanistanAlbaniaAlgeriaAngolaAntigua and BarbudaArab WorldArgentinaArmeniaArubaAustraliaAustriaAzerbaijanBahamas, TheBahrainBangladeshBarbadosBelarusBelgiumBelizeBeninBermudaBhutanBoliviaBosnia and HerzegovinaBotswanaBrazilBrunei DarussalamBulgariaBurkina FasoBurundiCabo VerdeCambodiaCameroonCanadaCaribbean small statesCentral African RepublicCentral Europe and the BalticsChadChileChinaColombiaComorosCongo, Dem. Rep.Congo, Rep.Cote d'IvoireCroatiaCubaCyprusCzech RepublicDenmarkDominicaDominican RepublicEarly-demographic dividendEast Asia & PacificEast Asia & Pacific (excluding high income)East Asia & Pacific (IDA & IBRD countries)EcuadorEgypt, Arab Rep.El SalvadorEquatorial GuineaEritreaEstoniaEuro areaEurope & Central AsiaEurope & Central Asia (excluding high income)Europe & Central Asia (IDA & IBRD countries)European UnionFaroe IslandsFinlandFragile and conflict affected situationsFranceGabonGambia, TheGeorgiaGermanyGhanaGreeceGrenadaGuatemalaGuineaGuinea-BissauGuyanaHaitiHeavily indebted poor countries (HIPC)High incomeHondurasHong Kong SAR, ChinaHungaryIBRD onlyIcelandIDA & IBRD totalIDA blendIDA onlyIDA totalIndiaIndonesiaIran, Islamic Rep.IraqIrelandIsraelItalyJamaicaJapanJordanKazakhstanKenyaKorea, Rep.KosovoKuwaitKyrgyz RepublicLao PDRLate-demographic dividendLatin America & Caribbean Latin America & Caribbean (excluding high income)Latin America & the Caribbean (IDA & IBRD countries)LatviaLeast developed countries: UN classificationLebanonLiberiaLithuaniaLow & middle incomeLow incomeLower middle incomeLuxembourgMacao SAR, ChinaMacedonia, FYRMadagascarMalawiMalaysiaMaliMaltaMauritaniaMauritiusMexicoMiddle East & North AfricaMiddle East & North Africa (excluding high income)Middle East & North Africa (IDA & IBRD countries)Middle incomeMoldovaMongoliaMontenegroMoroccoMozambiqueNamibiaNepalNetherlandsNew ZealandNicaraguaNigerNigeriaNorth AmericaNorwayOECD membersOmanOther small statesPakistanPanamaParaguayPeruPhilippinesPolandPortugalPost-demographic dividendPre-demographic dividendPuerto RicoQatarRomaniaRussian FederationRwandaSaudi ArabiaSenegalSerbiaSeychellesSierra LeoneSingaporeSlovak RepublicSloveniaSmall statesSouth AfricaSouth AsiaSouth Asia (IDA & IBRD)South SudanSpainSri LankaSt. Kitts and NevisSt. LuciaSt. Vincent and the GrenadinesSub-Saharan Africa Sub-Saharan Africa (excluding high income)Sub-Saharan Africa (IDA & IBRD countries)SudanSurinameSwazilandSwedenSwitzerlandTajikistanTanzaniaThailandTimor-LesteTogoTongaTrinidad and TobagoTunisiaTurkeyTurkmenistanUgandaUkraineUnited Arab EmiratesUnited KingdomUnited StatesUpper middle incomeUruguayUzbekistanVanuatuVenezuela, RBVietnamWest Bank and GazaWorldYemen, Rep.ZambiaZimbabwe La ligne de temps
Cette échelle de temps montre un graphique de 1981 année à 2016 année Equatorial Guinea. Les données jusqu'à 1980 année ne sont pas présentés. Quantité d'observations actuelles selon dates: 36.
Source (désignation):
Les indicateurs du développement mondiale
Source (organisation):
World Bank national accounts data, and OECD National Accounts data files.
Catégories:
Economy & Growth
Dernière mise à jour
23 avr. 2017
Les indicateurs de changement de valeurs selon les années
Minimum:
-14.864 mln.
1 janv. 2001
Maximum:
8.124 mds
1 janv. 2014
Pour la date d''observation
Valeur
Changement absolu
Le changement par rapport à la valeur précédente
1 janv. 1981
296.998 mln.
+296.998 mln.
0.0%
1 janv. 1982
380.137 mln.
+83.139 mln.
27.99%
1 janv. 1983
298.431 mln.
-81.706 mln.
-21.49%
1 janv. 1984
193.734 mln.
-104.697 mln.
-35.08%
1 janv. 1985
242.321 mln.
+48.587 mln.
25.08%
1 janv. 1986
222.256 mln.
-20.064 mln.
-8.28%
1 janv. 1987
221.569 mln.
-687.136 milles
-0.31%
1 janv. 1988
229.949 mln.
+8.38 mln.
3.78%
1 janv. 1989
250.723 mln.
+20.774 mln.
9.03%
1 janv. 1990
212.225 mln.
-38.498 mln.
-15.35%
1 janv. 1991
181.249 mln.
-30.976 mln.
-14.6%
1 janv. 1992
232.722 mln.
+51.473 mln.
28.4%
1 janv. 1993
257.948 mln.
+25.226 mln.
10.84%
1 janv. 1994
227.313 mln.
-30.635 mln.
-11.88%
1 janv. 1995
161.568 mln.
-65.745 mln.
-28.92%
1 janv. 1996
370.286 mln.
+208.718 mln.
129.18%
1 janv. 1997
682.98 mln.
+312.694 mln.
84.45%
1 janv. 1998
697.871 mln.
+14.891 mln.
2.18%
1 janv. 1999
1.135 mds
+437.489 mln.
62.69%
1 janv. 2000
403.088 mln.
-732.272 mln.
-64.5%
1 janv. 2001
-14.864 mln.
-417.952 mln.
-103.69%
1 janv. 2002
182.221 mln.
+197.084 mln.
-1.33 milles%
1 janv. 2003
512.108 mln.
+329.888 mln.
181.04%
1 janv. 2004
1.318 mds
+805.471 mln.
157.29%
1 janv. 2005
2.455 mds
+1.137 mds
86.32%
1 janv. 2006
2.828 mds
+372.871 mln.
15.19%
1 janv. 2007
3.848 mds
+1.021 mds
36.09%
1 janv. 2008
4.321 mds
+472.143 mln.
12.27%
1 janv. 2009
4.933 mds
+612.218 mln.
14.17%
1 janv. 2010
5.209 mds
+276.496 mln.
5.61%
1 janv. 2011
5.72 mds
+510.729 mln.
9.8%
1 janv. 2012
6.312 mds
+592.045 mln.
10.35%
1 janv. 2013
6.722 mds
+410.029 mln.
6.5%
1 janv. 2014
8.124 mds
+1.402 mds
20.86%
1 janv. 2015
7.95 mds
-174.595 mln.
-2.15%
1 janv. 2016
8.075 mds
+125.47 mln.
1.58%
Classement des pays selon les statistiques actuelles par années


Commentaires: