29
/fr/
fr
AIzaSyAYiBZKx7MnpbEhh9jyipgxe19OcubqV5w
April 1, 2024
255135
Swaziland
SWZ
true
2
1
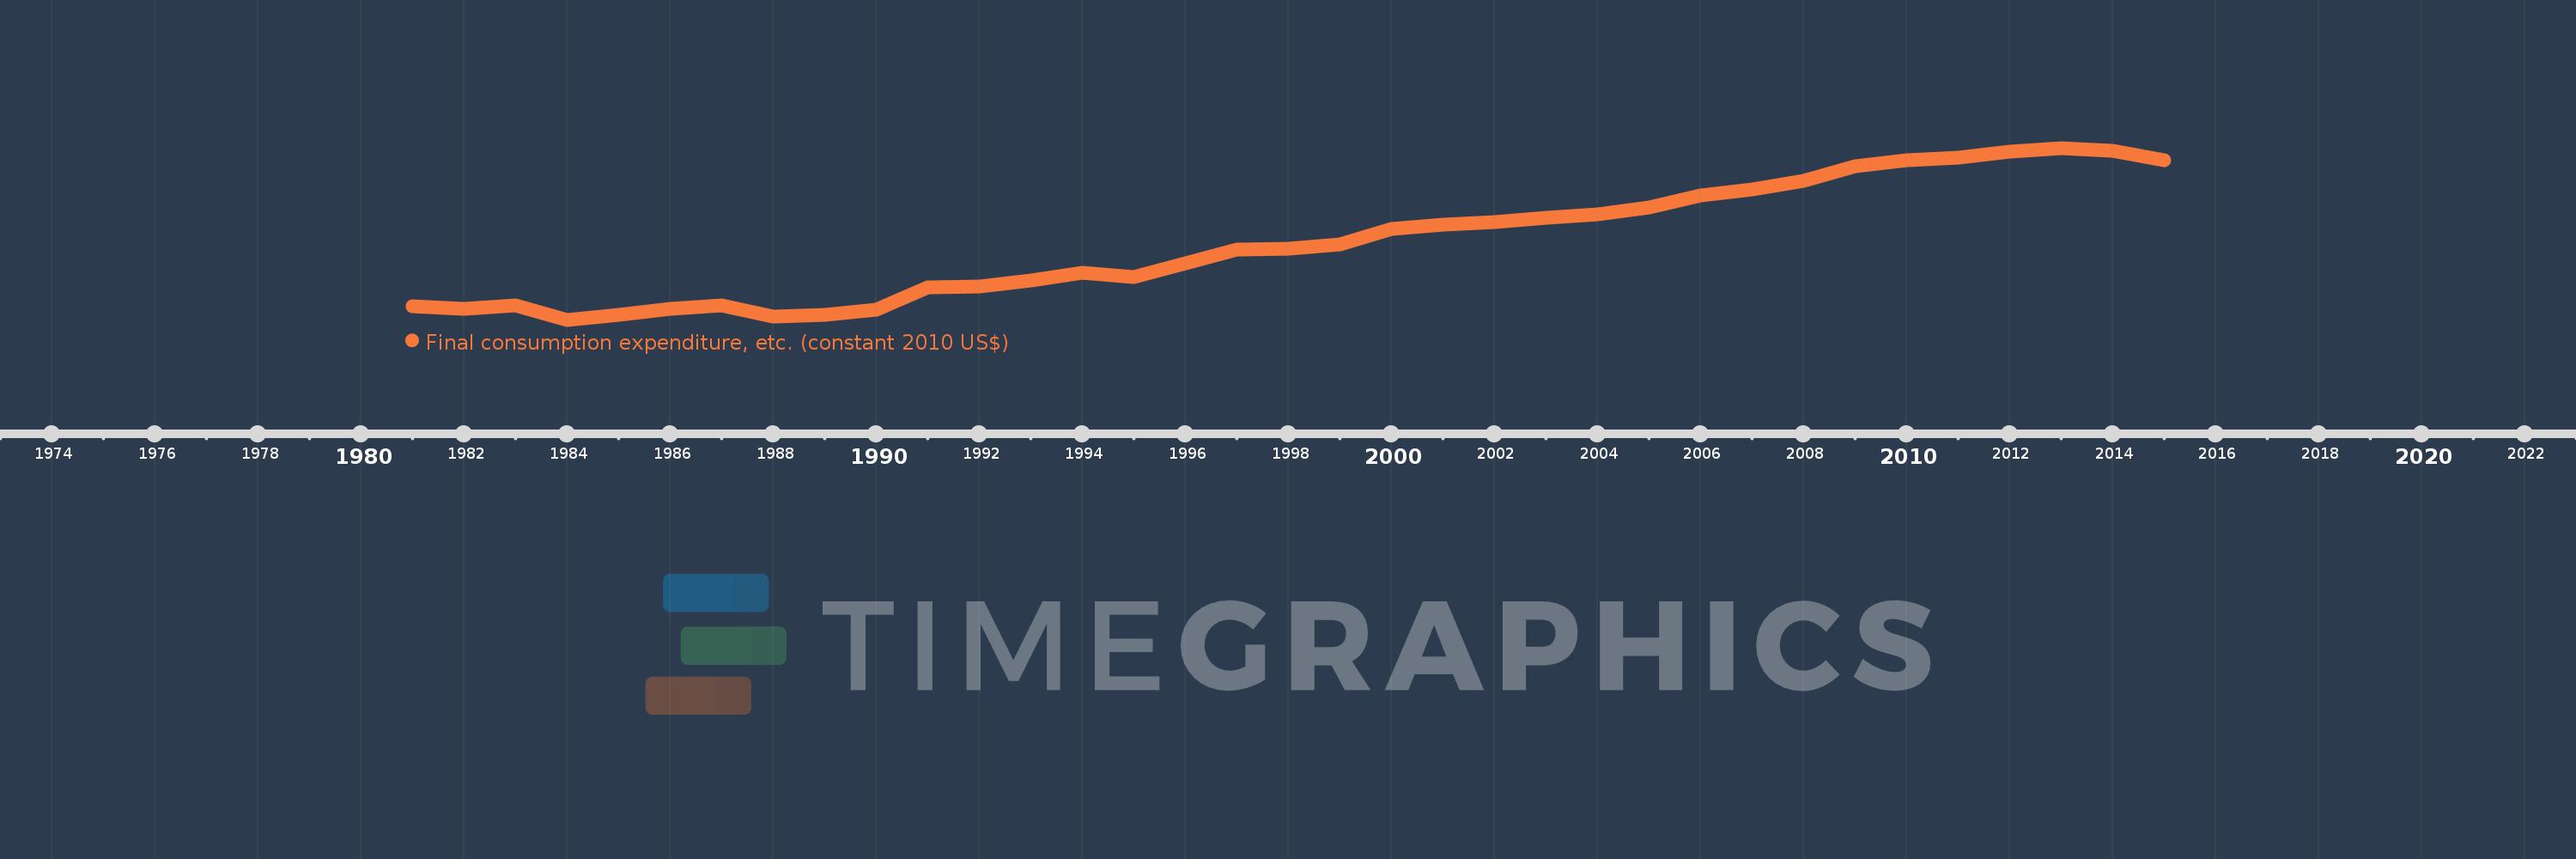
Final consumption expenditure, etc. (constant 2010 US$)
2015,2014,2013,2012,2011,2010,2009,2008,2007,2006,2005,2004,2003,2002,2001,2000,1999,1998,1997,1996,1995,1994,1993,1992,1991,1990,1989,1988,1987,1986,1985,1984,1983,1982,1981
Cette statistique dans les autres pays:
AfghanistanAlbaniaAlgeriaAngolaAntigua and BarbudaArab WorldArgentinaArmeniaArubaAustraliaAustriaAzerbaijanBahamas, TheBahrainBangladeshBarbadosBelarusBelgiumBelizeBeninBermudaBhutanBoliviaBosnia and HerzegovinaBotswanaBrazilBrunei DarussalamBulgariaBurkina FasoBurundiCabo VerdeCambodiaCameroonCanadaCaribbean small statesCentral African RepublicCentral Europe and the BalticsChadChileChinaColombiaComorosCongo, Dem. Rep.Congo, Rep.Cote d'IvoireCroatiaCubaCyprusCzech RepublicDenmarkDominicaDominican RepublicEarly-demographic dividendEast Asia & PacificEast Asia & Pacific (excluding high income)East Asia & Pacific (IDA & IBRD countries)EcuadorEgypt, Arab Rep.El SalvadorEquatorial GuineaEritreaEstoniaEuro areaEurope & Central AsiaEurope & Central Asia (excluding high income)Europe & Central Asia (IDA & IBRD countries)European UnionFaroe IslandsFinlandFragile and conflict affected situationsFranceGabonGambia, TheGeorgiaGermanyGhanaGreeceGrenadaGuatemalaGuineaGuinea-BissauGuyanaHaitiHeavily indebted poor countries (HIPC)High incomeHondurasHong Kong SAR, ChinaHungaryIBRD onlyIcelandIDA & IBRD totalIDA blendIDA onlyIDA totalIndiaIndonesiaIran, Islamic Rep.IraqIrelandIsraelItalyJamaicaJapanJordanKazakhstanKenyaKorea, Rep.KosovoKuwaitKyrgyz RepublicLao PDRLate-demographic dividendLatin America & Caribbean Latin America & Caribbean (excluding high income)Latin America & the Caribbean (IDA & IBRD countries)LatviaLeast developed countries: UN classificationLebanonLiberiaLithuaniaLow & middle incomeLow incomeLower middle incomeLuxembourgMacao SAR, ChinaMacedonia, FYRMadagascarMalawiMalaysiaMaliMaltaMauritaniaMauritiusMexicoMiddle East & North AfricaMiddle East & North Africa (excluding high income)Middle East & North Africa (IDA & IBRD countries)Middle incomeMoldovaMongoliaMontenegroMoroccoMozambiqueNamibiaNepalNetherlandsNew ZealandNicaraguaNigerNigeriaNorth AmericaNorwayOECD membersOmanOther small statesPakistanPanamaParaguayPeruPhilippinesPolandPortugalPost-demographic dividendPre-demographic dividendPuerto RicoQatarRomaniaRussian FederationRwandaSaudi ArabiaSenegalSerbiaSeychellesSierra LeoneSingaporeSlovak RepublicSloveniaSmall statesSouth AfricaSouth AsiaSouth Asia (IDA & IBRD)South SudanSpainSri LankaSt. Kitts and NevisSt. LuciaSt. Vincent and the GrenadinesSub-Saharan Africa Sub-Saharan Africa (excluding high income)Sub-Saharan Africa (IDA & IBRD countries)SudanSurinameSwazilandSwedenSwitzerlandTajikistanTanzaniaThailandTimor-LesteTogoTongaTrinidad and TobagoTunisiaTurkeyTurkmenistanUgandaUkraineUnited Arab EmiratesUnited KingdomUnited StatesUpper middle incomeUruguayUzbekistanVanuatuVenezuela, RBVietnamWest Bank and GazaWorldYemen, Rep.ZambiaZimbabwe La ligne de temps
Cette échelle de temps montre un graphique de 1981 année à 2015 année Swaziland. Les données jusqu'à 1980 année ne sont pas présentés. Quantité d'observations actuelles selon dates: 35.
Source (désignation):
Les indicateurs du développement mondiale
Source (organisation):
World Bank national accounts data, and OECD National Accounts data files.
Catégories:
Economy & Growth
Dernière mise à jour
23 avr. 2017
Les indicateurs de changement de valeurs selon les années
Minimum:
622.613 mln.
1 janv. 1984
Maximum:
4.6 mds
1 janv. 2013
Pour la date d''observation
Valeur
Changement absolu
Le changement par rapport à la valeur précédente
1 janv. 1981
937.466 mln.
+937.466 mln.
0.0%
1 janv. 1982
873.077 mln.
-64.389 mln.
-6.87%
1 janv. 1983
945.421 mln.
+72.344 mln.
8.29%
1 janv. 1984
622.613 mln.
-322.808 mln.
-34.14%
1 janv. 1985
730.626 mln.
+108.013 mln.
17.35%
1 janv. 1986
883.828 mln.
+153.202 mln.
20.97%
1 janv. 1987
947.129 mln.
+63.3 mln.
7.16%
1 janv. 1988
691.959 mln.
-255.17 mln.
-26.94%
1 janv. 1989
729.968 mln.
+38.009 mln.
5.49%
1 janv. 1990
845.606 mln.
+115.638 mln.
15.84%
1 janv. 1991
1.367 mds
+521.312 mln.
61.65%
1 janv. 1992
1.397 mds
+30.513 mln.
2.23%
1 janv. 1993
1.522 mds
+124.391 mln.
8.9%
1 janv. 1994
1.713 mds
+191.336 mln.
12.57%
1 janv. 1995
1.606 mds
-107.3 mln.
-6.26%
1 janv. 1996
1.928 mds
+322.533 mln.
20.08%
1 janv. 1997
2.243 mds
+314.451 mln.
16.31%
1 janv. 1998
2.262 mds
+19.006 mln.
0.85%
1 janv. 1999
2.375 mds
+113.074 mln.
5.0%
1 janv. 2000
2.73 mds
+355.312 mln.
14.96%
1 janv. 2001
2.823 mds
+92.417 mln.
3.38%
1 janv. 2002
2.876 mds
+53.272 mln.
1.89%
1 janv. 2003
2.991 mds
+114.745 mln.
3.99%
1 janv. 2004
3.065 mds
+74.02 mln.
2.48%
1 janv. 2005
3.228 mds
+163.736 mln.
5.34%
1 janv. 2006
3.499 mds
+270.388 mln.
8.38%
1 janv. 2007
3.63 mds
+131.037 mln.
3.75%
1 janv. 2008
3.833 mds
+203.539 mln.
5.61%
1 janv. 2009
4.182 mds
+348.192 mln.
9.08%
1 janv. 2010
4.309 mds
+127.342 mln.
3.05%
1 janv. 2011
4.369 mds
+60.181 mln.
1.4%
1 janv. 2012
4.504 mds
+135.211 mln.
3.09%
1 janv. 2013
4.6 mds
+95.224 mln.
2.11%
1 janv. 2014
4.529 mds
-70.176 mln.
-1.53%
1 janv. 2015
4.324 mds
-205.486 mln.
-4.54%
Classement des pays selon les statistiques actuelles par années


Commentaires: