29
/fr/
fr
AIzaSyAYiBZKx7MnpbEhh9jyipgxe19OcubqV5w
April 1, 2024
252787
Sudan
SDN
true
2
1
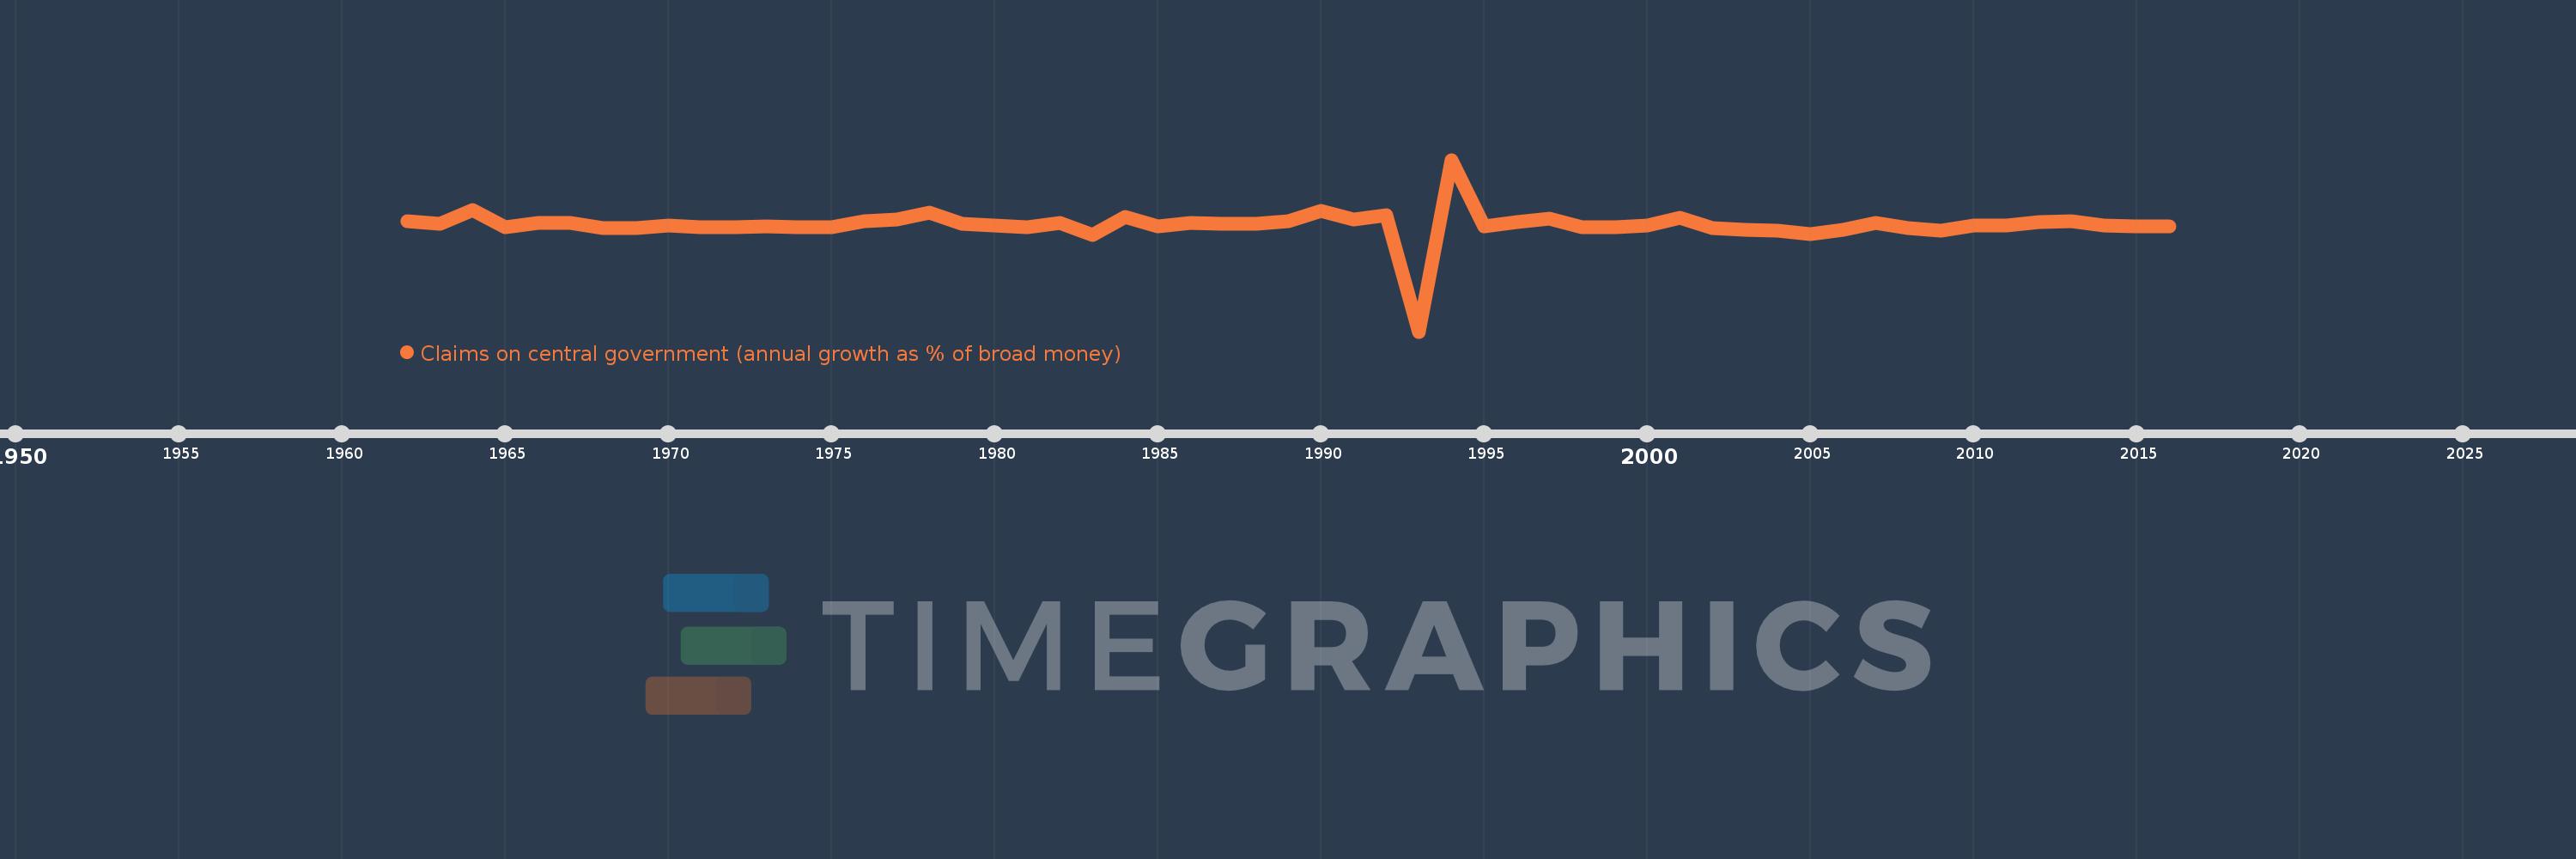
Claims on central government (annual growth as % of broad money)
2016,2015,2014,2013,2012,2011,2010,2009,2008,2007,2006,2005,2004,2003,2002,2001,2000,1999,1998,1997,1996,1995,1994,1993,1992,1991,1990,1989,1988,1987,1986,1985,1984,1983,1982,1981,1980,1979,1978,1977,1976,1975,1974,1973,1972,1971,1970,1969,1968,1967,1966,1965,1964,1963,1962
Cette statistique dans les autres pays:
AfghanistanAlbaniaAlgeriaAngolaAntigua and BarbudaArgentinaArmeniaArubaAustraliaAzerbaijanBahamas, TheBahrainBangladeshBarbadosBelarusBelizeBeninBhutanBoliviaBosnia and HerzegovinaBotswanaBrazilBrunei DarussalamBulgariaBurkina FasoBurundiCabo VerdeCambodiaCameroonCanadaCentral African RepublicChadChileChinaColombiaComorosCongo, Dem. Rep.Congo, Rep.Costa RicaCote d'IvoireCroatiaCzech RepublicDenmarkDjiboutiDominicaDominican RepublicEcuadorEgypt, Arab Rep.El SalvadorEquatorial GuineaEritreaEstoniaEthiopiaFijiGabonGambia, TheGeorgiaGhanaGrenadaGuatemalaGuineaGuinea-BissauGuyanaHaitiHondurasHong Kong SAR, ChinaHungaryIcelandIndiaIndonesiaIran, Islamic Rep.IraqIsraelJamaicaJapanJordanKazakhstanKenyaKorea, Rep.KuwaitKyrgyz RepublicLao PDRLatviaLebanonLesothoLiberiaLibyaLithuaniaMacao SAR, ChinaMacedonia, FYRMadagascarMalawiMalaysiaMaldivesMaliMauritaniaMauritiusMexicoMicronesia, Fed. Sts.MoldovaMongoliaMoroccoMozambiqueMyanmarNamibiaNepalNew ZealandNicaraguaNigerNigeriaNorwayOmanPakistanPanamaPapua New GuineaParaguayPeruPhilippinesPolandQatarRomaniaRussian FederationRwandaSamoaSao Tome and PrincipeSaudi ArabiaSenegalSerbiaSeychellesSierra LeoneSingaporeSlovak RepublicSolomon IslandsSouth AfricaSouth SudanSri LankaSt. Kitts and NevisSt. LuciaSt. Vincent and the GrenadinesSudanSurinameSwazilandSwedenSwitzerlandSyrian Arab RepublicTajikistanTanzaniaThailandTimor-LesteTogoTongaTrinidad and TobagoTunisiaTurkeyUgandaUkraineUnited Arab EmiratesUnited KingdomUnited StatesUruguayVanuatuVenezuela, RBVietnamWest Bank and GazaYemen, Rep.ZambiaZimbabwe La ligne de temps
Cette échelle de temps montre un graphique de 1962 année à 2016 année Sudan. Les données jusqu'à 1961 année ne sont pas présentés. Quantité d'observations actuelles selon dates: 55.
Source (désignation):
Les indicateurs du développement mondiale
Source (organisation):
International Monetary Fund, International Financial Statistics and data files.
Catégories:
Financial Sector
Dernière mise à jour
23 avr. 2017
Les indicateurs de changement de valeurs selon les années
Minimum:
-272.706
1 janv. 1993
Maximum:
189.692
1 janv. 1994
Pour la date d''observation
Valeur
Changement absolu
Le changement par rapport à la valeur précédente
1 janv. 1962
24.617
+24.617
0.0%
1 janv. 1963
16.769
-7.848
-31.88%
1 janv. 1964
54.388
+37.619
224.34%
1 janv. 1965
8.433
-45.955
-84.49%
1 janv. 1966
19.859
+11.425
135.48%
1 janv. 1967
20.223
+0.364
1.83%
1 janv. 1968
5.123
-15.1
-74.67%
1 janv. 1969
6.367
+1.244
24.28%
1 janv. 1970
13.438
+7.071
111.06%
1 janv. 1971
9.054
-4.384
-32.63%
1 janv. 1972
9.26
+0.206
2.28%
1 janv. 1973
9.943
+0.683
7.37%
1 janv. 1974
8.77
-1.173
-11.79%
1 janv. 1975
9.317
+0.546
6.23%
1 janv. 1976
24.573
+15.257
163.76%
1 janv. 1977
28.436
+3.863
15.72%
1 janv. 1978
47.108
+18.672
65.66%
1 janv. 1979
17.846
-29.261
-62.12%
1 janv. 1980
12.597
-5.25
-29.42%
1 janv. 1981
9.157
-3.44
-27.31%
1 janv. 1982
20.536
+11.379
124.27%
1 janv. 1983
-13.662
-34.198
-166.52%
1 janv. 1984
35.046
+48.708
-356.53%
1 janv. 1985
11.095
-23.951
-68.34%
1 janv. 1986
18.952
+7.857
70.81%
1 janv. 1987
16.429
-2.523
-13.31%
1 janv. 1988
17.679
+1.25
7.61%
1 janv. 1989
24.319
+6.641
37.56%
1 janv. 1990
51.778
+27.458
112.91%
1 janv. 1991
27.937
-23.841
-46.04%
1 janv. 1992
40.579
+12.642
45.25%
1 janv. 1993
-272.706
-313.285
-772.03%
1 janv. 1994
189.692
+462.398
-169.56%
1 janv. 1995
11.091
-178.6
-94.15%
1 janv. 1996
22.247
+11.155
100.58%
1 janv. 1997
32.433
+10.187
45.79%
1 janv. 1998
8.539
-23.895
-73.67%
1 janv. 1999
9.192
+0.653
7.64%
1 janv. 2000
13.163
+3.971
43.2%
1 janv. 2001
33.85
+20.687
157.16%
1 janv. 2002
4.821
-29.029
-85.76%
1 janv. 2003
1.253
-3.568
-74.01%
1 janv. 2004
-1.154
-2.407
-192.1%
1 janv. 2005
-9.238
-8.084
700.53%
1 janv. 2006
2.355
+11.592
-125.49%
1 janv. 2007
19.841
+17.487
742.69%
1 janv. 2008
5.092
-14.749
-74.34%
1 janv. 2009
-0.93
-6.021
-118.26%
1 janv. 2010
13.41
+14.339
-1.54 milles%
1 janv. 2011
12.898
-0.512
-3.82%
1 janv. 2012
21.053
+8.156
63.23%
1 janv. 2013
24.513
+3.459
16.43%
1 janv. 2014
12.689
-11.824
-48.24%
1 janv. 2015
9.567
-3.122
-24.6%
1 janv. 2016
9.716
+0.15
1.56%
Classement des pays selon les statistiques actuelles par années


Commentaires: