29
/fr/
fr
AIzaSyAYiBZKx7MnpbEhh9jyipgxe19OcubqV5w
April 1, 2024
147712
Guyana
GUY
true
2
1
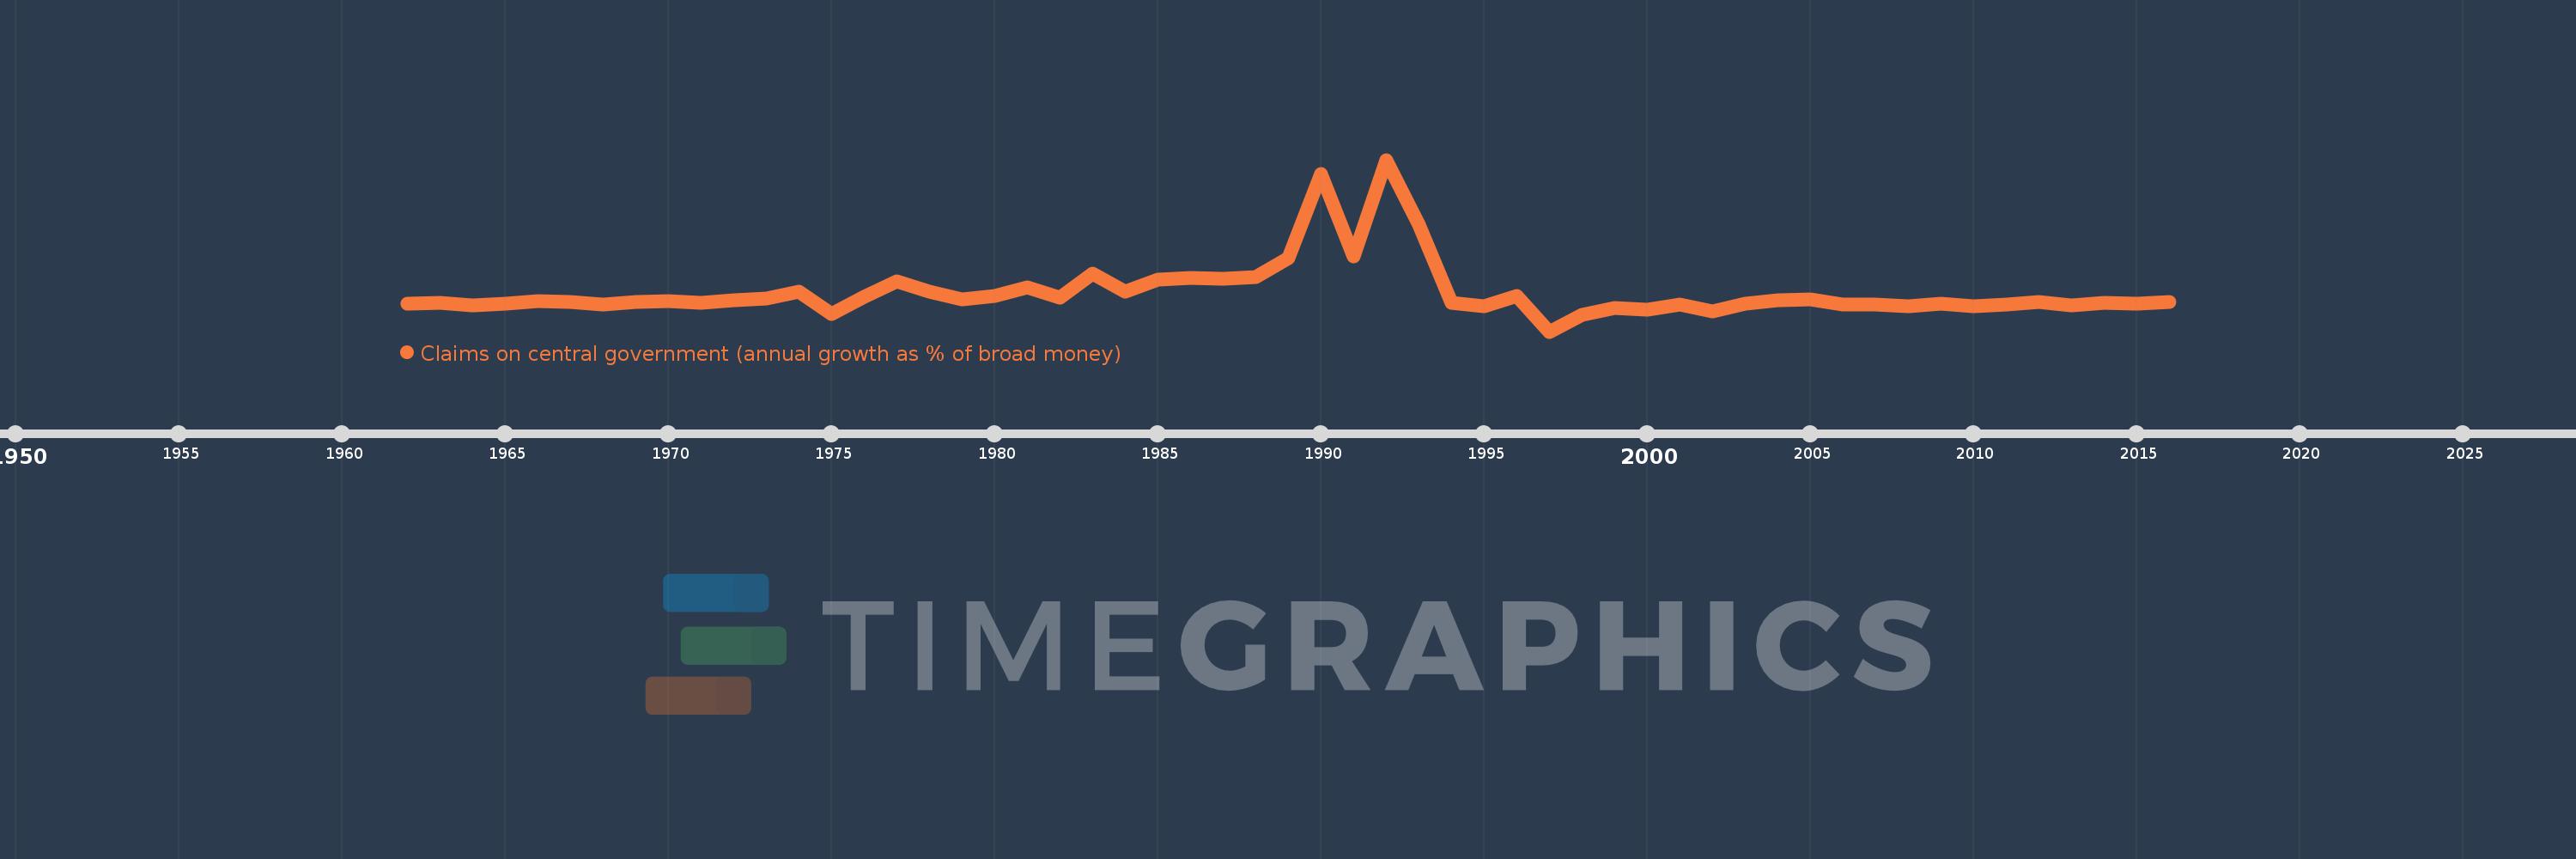
Claims on central government (annual growth as % of broad money)
2016,2015,2014,2013,2012,2011,2010,2009,2008,2007,2006,2005,2004,2003,2002,2001,2000,1999,1998,1997,1996,1995,1994,1993,1992,1991,1990,1989,1988,1987,1986,1985,1984,1983,1982,1981,1980,1979,1978,1977,1976,1975,1974,1973,1972,1971,1970,1969,1968,1967,1966,1965,1964,1963,1962
Cette statistique dans les autres pays:
AfghanistanAlbaniaAlgeriaAngolaAntigua and BarbudaArgentinaArmeniaArubaAustraliaAzerbaijanBahamas, TheBahrainBangladeshBarbadosBelarusBelizeBeninBhutanBoliviaBosnia and HerzegovinaBotswanaBrazilBrunei DarussalamBulgariaBurkina FasoBurundiCabo VerdeCambodiaCameroonCanadaCentral African RepublicChadChileChinaColombiaComorosCongo, Dem. Rep.Congo, Rep.Costa RicaCote d'IvoireCroatiaCzech RepublicDenmarkDjiboutiDominicaDominican RepublicEcuadorEgypt, Arab Rep.El SalvadorEquatorial GuineaEritreaEstoniaEthiopiaFijiGabonGambia, TheGeorgiaGhanaGrenadaGuatemalaGuineaGuinea-BissauGuyanaHaitiHondurasHong Kong SAR, ChinaHungaryIcelandIndiaIndonesiaIran, Islamic Rep.IraqIsraelJamaicaJapanJordanKazakhstanKenyaKorea, Rep.KuwaitKyrgyz RepublicLao PDRLatviaLebanonLesothoLiberiaLibyaLithuaniaMacao SAR, ChinaMacedonia, FYRMadagascarMalawiMalaysiaMaldivesMaliMauritaniaMauritiusMexicoMicronesia, Fed. Sts.MoldovaMongoliaMoroccoMozambiqueMyanmarNamibiaNepalNew ZealandNicaraguaNigerNigeriaNorwayOmanPakistanPanamaPapua New GuineaParaguayPeruPhilippinesPolandQatarRomaniaRussian FederationRwandaSamoaSao Tome and PrincipeSaudi ArabiaSenegalSerbiaSeychellesSierra LeoneSingaporeSlovak RepublicSolomon IslandsSouth AfricaSouth SudanSri LankaSt. Kitts and NevisSt. LuciaSt. Vincent and the GrenadinesSudanSurinameSwazilandSwedenSwitzerlandSyrian Arab RepublicTajikistanTanzaniaThailandTimor-LesteTogoTongaTrinidad and TobagoTunisiaTurkeyUgandaUkraineUnited Arab EmiratesUnited KingdomUnited StatesUruguayVanuatuVenezuela, RBVietnamWest Bank and GazaYemen, Rep.ZambiaZimbabwe La ligne de temps
Cette échelle de temps montre un graphique de 1962 année à 2016 année Guyana. Les données jusqu'à 1961 année ne sont pas présentés. Quantité d'observations actuelles selon dates: 55.
Source (désignation):
Les indicateurs du développement mondiale
Source (organisation):
International Monetary Fund, International Financial Statistics and data files.
Catégories:
Financial Sector
Dernière mise à jour
23 avr. 2017
Les indicateurs de changement de valeurs selon les années
Minimum:
-63.083
1 janv. 1997
Maximum:
333.477
1 janv. 1992
Pour la date d''observation
Valeur
Changement absolu
Le changement par rapport à la valeur précédente
1 janv. 1962
1.286
+1.286
0.0%
1 janv. 1963
2.467
+1.181
91.82%
1 janv. 1964
-2.089
-4.556
-184.68%
1 janv. 1965
0.713
+2.803
-134.15%
1 janv. 1966
7.427
+6.713
940.99%
1 janv. 1967
6.299
-1.128
-15.18%
1 janv. 1968
0.359
-5.94
-94.3%
1 janv. 1969
6.3
+5.941
1.65 milles%
1 janv. 1970
7.828
+1.529
24.27%
1 janv. 1971
3.195
-4.634
-59.19%
1 janv. 1972
9.427
+6.232
195.06%
1 janv. 1973
12.771
+3.345
35.48%
1 janv. 1974
29.855
+17.083
133.76%
1 janv. 1975
-22.567
-52.421
-175.59%
1 janv. 1976
17.331
+39.898
-176.8%
1 janv. 1977
53.186
+35.854
206.88%
1 janv. 1978
28.868
-24.317
-45.72%
1 janv. 1979
11.395
-17.473
-60.53%
1 janv. 1980
19.779
+8.384
73.58%
1 janv. 1981
38.804
+19.025
96.19%
1 janv. 1982
15.056
-23.748
-61.2%
1 janv. 1983
71.342
+56.286
373.85%
1 janv. 1984
28.159
-43.183
-60.53%
1 janv. 1985
57.07
+28.912
102.67%
1 janv. 1986
60.056
+2.986
5.23%
1 janv. 1987
58.153
-1.903
-3.17%
1 janv. 1988
62.964
+4.811
8.27%
1 janv. 1989
107.247
+44.283
70.33%
1 janv. 1990
300.54
+193.293
180.23%
1 janv. 1991
110.292
-190.248
-63.3%
1 janv. 1992
333.477
+223.185
202.36%
1 janv. 1993
183.114
-150.362
-45.09%
1 janv. 1994
2.656
-180.459
-98.55%
1 janv. 1995
-3.803
-6.459
-243.19%
1 janv. 1996
19.235
+23.038
-605.78%
1 janv. 1997
-63.083
-82.318
-427.96%
1 janv. 1998
-25.241
+37.842
-59.99%
1 janv. 1999
-7.976
+17.265
-68.4%
1 janv. 2000
-11.947
-3.971
49.79%
1 janv. 2001
-0.001
+11.946
-99.99%
1 janv. 2002
-16.905
-16.904
1.2 mln.%
1 janv. 2003
1.85
+18.755
-110.94%
1 janv. 2004
8.308
+6.458
349.1%
1 janv. 2005
12.092
+3.783
45.53%
1 janv. 2006
-1.535
-13.627
-112.7%
1 janv. 2007
-1.562
-0.027
1.74%
1 janv. 2008
-4.577
-3.015
193.0%
1 janv. 2009
0.648
+5.224
-114.15%
1 janv. 2010
-4.195
-4.843
-747.67%
1 janv. 2011
0.255
+4.45
-106.08%
1 janv. 2012
4.806
+4.551
1.79 milles%
1 janv. 2013
-2.827
-7.633
-158.82%
1 janv. 2014
3.056
+5.883
-208.11%
1 janv. 2015
2.113
-0.943
-30.85%
1 janv. 2016
4.682
+2.569
121.55%
Classement des pays selon les statistiques actuelles par années


Commentaires: