29
/fr/
fr
AIzaSyAYiBZKx7MnpbEhh9jyipgxe19OcubqV5w
April 1, 2024
227216
Qatar
QAT
true
2
1
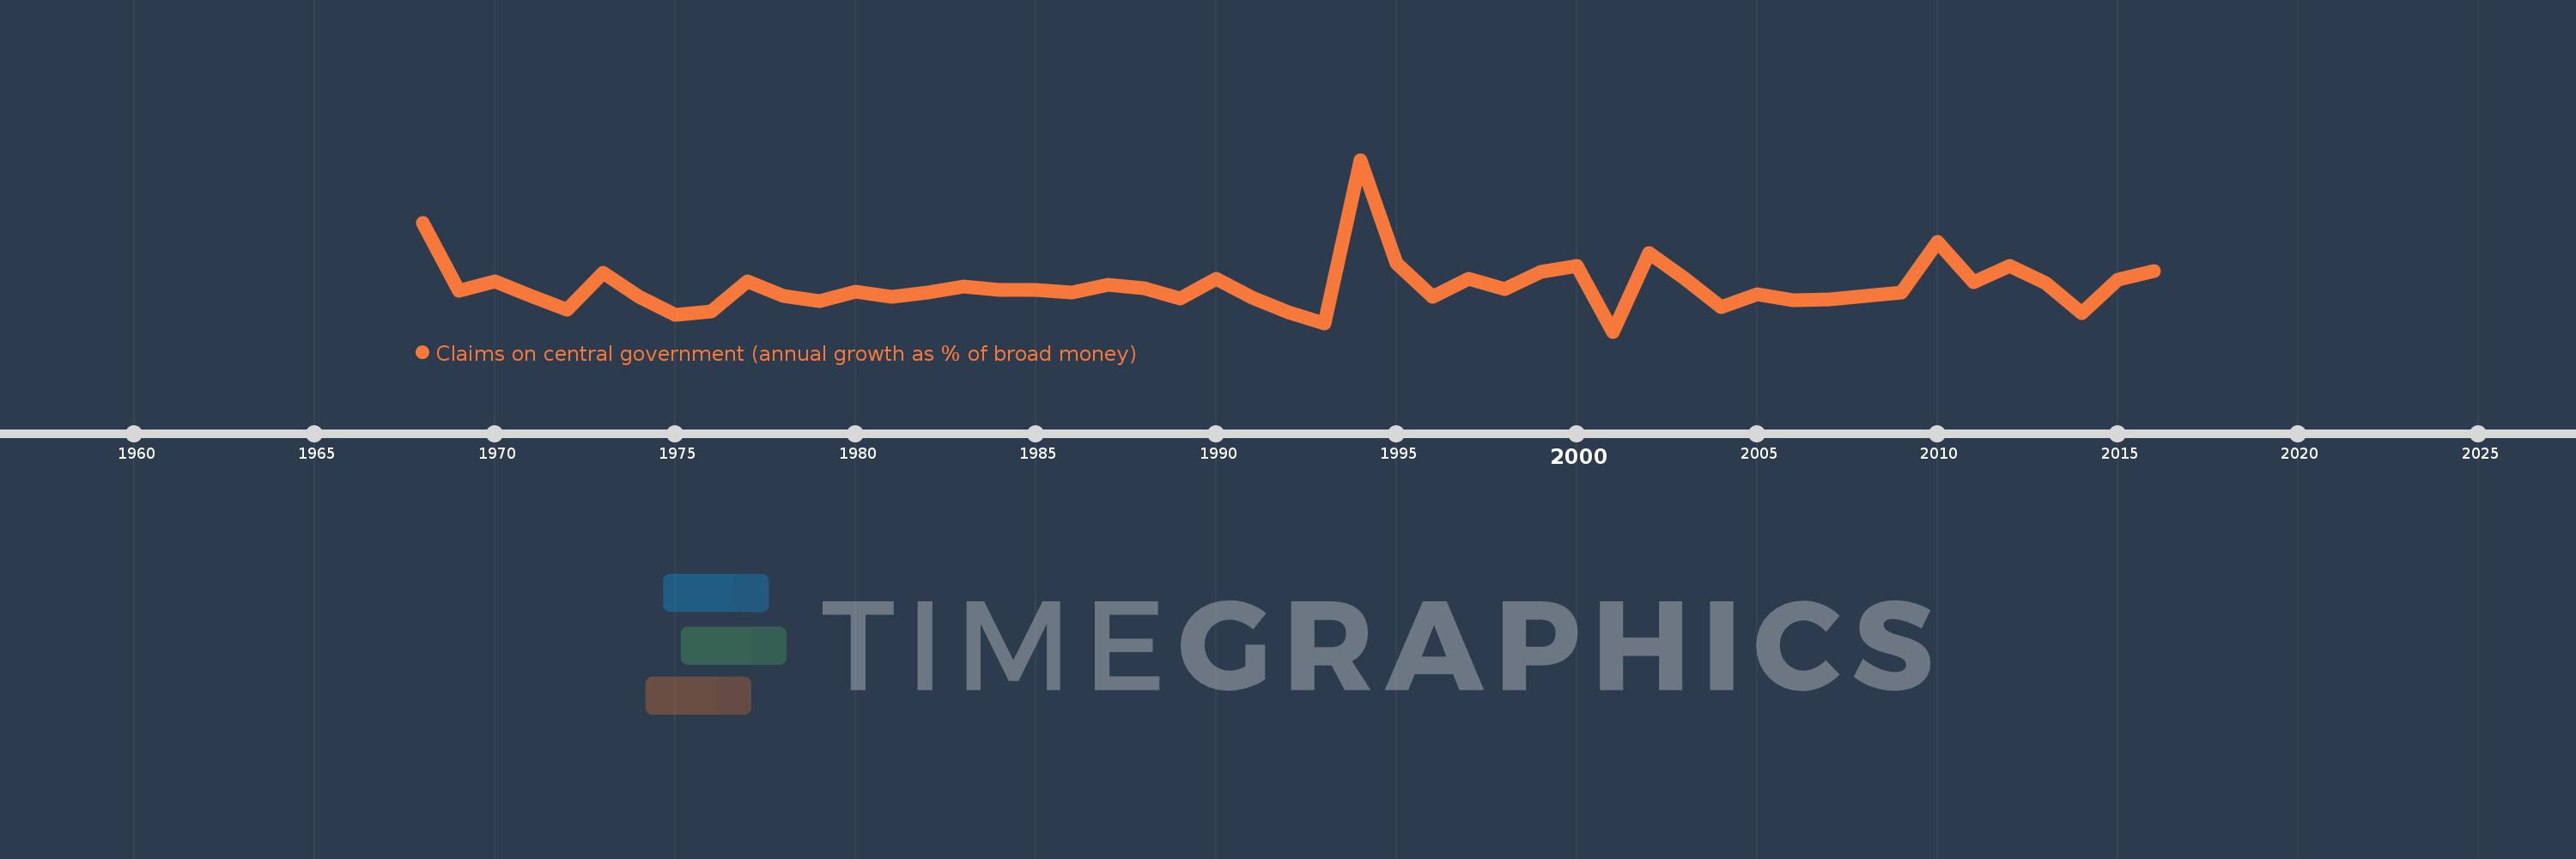
Claims on central government (annual growth as % of broad money)
2016,2015,2014,2013,2012,2011,2010,2009,2008,2007,2006,2005,2004,2003,2002,2001,2000,1999,1998,1997,1996,1995,1994,1993,1992,1991,1990,1989,1988,1987,1986,1985,1984,1983,1982,1981,1980,1979,1978,1977,1976,1975,1974,1973,1972,1971,1970,1969,1968
Cette statistique dans les autres pays:
AfghanistanAlbaniaAlgeriaAngolaAntigua and BarbudaArgentinaArmeniaArubaAustraliaAzerbaijanBahamas, TheBahrainBangladeshBarbadosBelarusBelizeBeninBhutanBoliviaBosnia and HerzegovinaBotswanaBrazilBrunei DarussalamBulgariaBurkina FasoBurundiCabo VerdeCambodiaCameroonCanadaCentral African RepublicChadChileChinaColombiaComorosCongo, Dem. Rep.Congo, Rep.Costa RicaCote d'IvoireCroatiaCzech RepublicDenmarkDjiboutiDominicaDominican RepublicEcuadorEgypt, Arab Rep.El SalvadorEquatorial GuineaEritreaEstoniaEthiopiaFijiGabonGambia, TheGeorgiaGhanaGrenadaGuatemalaGuineaGuinea-BissauGuyanaHaitiHondurasHong Kong SAR, ChinaHungaryIcelandIndiaIndonesiaIran, Islamic Rep.IraqIsraelJamaicaJapanJordanKazakhstanKenyaKorea, Rep.KuwaitKyrgyz RepublicLao PDRLatviaLebanonLesothoLiberiaLibyaLithuaniaMacao SAR, ChinaMacedonia, FYRMadagascarMalawiMalaysiaMaldivesMaliMauritaniaMauritiusMexicoMicronesia, Fed. Sts.MoldovaMongoliaMoroccoMozambiqueMyanmarNamibiaNepalNew ZealandNicaraguaNigerNigeriaNorwayOmanPakistanPanamaPapua New GuineaParaguayPeruPhilippinesPolandQatarRomaniaRussian FederationRwandaSamoaSao Tome and PrincipeSaudi ArabiaSenegalSerbiaSeychellesSierra LeoneSingaporeSlovak RepublicSolomon IslandsSouth AfricaSouth SudanSri LankaSt. Kitts and NevisSt. LuciaSt. Vincent and the GrenadinesSudanSurinameSwazilandSwedenSwitzerlandSyrian Arab RepublicTajikistanTanzaniaThailandTimor-LesteTogoTongaTrinidad and TobagoTunisiaTurkeyUgandaUkraineUnited Arab EmiratesUnited KingdomUnited StatesUruguayVanuatuVenezuela, RBVietnamWest Bank and GazaYemen, Rep.ZambiaZimbabwe La ligne de temps
Cette échelle de temps montre un graphique de 1968 année à 2016 année Qatar. Les données jusqu'à 1967 année ne sont pas présentés. Quantité d'observations actuelles selon dates: 49.
Source (désignation):
Les indicateurs du développement mondiale
Source (organisation):
International Monetary Fund, International Financial Statistics and data files.
Catégories:
Financial Sector
Dernière mise à jour
23 avr. 2017
Les indicateurs de changement de valeurs selon les années
Minimum:
-23.144
1 janv. 2001
Maximum:
72.01
1 janv. 1994
Pour la date d''observation
Valeur
Changement absolu
Le changement par rapport à la valeur précédente
1 janv. 1968
37.182
+37.182
0.0%
1 janv. 1969
-0.435
-37.617
-101.17%
1 janv. 1970
4.668
+5.103
-1.17 milles%
1 janv. 1971
-3.597
-8.264
-177.06%
1 janv. 1972
-10.905
-7.308
203.18%
1 janv. 1973
9.596
+20.501
-188.0%
1 janv. 1974
-3.739
-13.335
-138.97%
1 janv. 1975
-13.639
-9.9
264.76%
1 janv. 1976
-12.054
+1.585
-11.62%
1 janv. 1977
4.892
+16.947
-140.59%
1 janv. 1978
-3.372
-8.265
-168.93%
1 janv. 1979
-6.073
-2.701
80.09%
1 janv. 1980
-1.152
+4.921
-81.03%
1 janv. 1981
-3.855
-2.703
234.56%
1 janv. 1982
-1.518
+2.337
-60.62%
1 janv. 1983
1.749
+3.267
-215.24%
1 janv. 1984
-0.303
-2.052
-117.32%
1 janv. 1985
-0.216
+0.087
-28.78%
1 janv. 1986
-1.592
-1.376
637.82%
1 janv. 1987
2.82
+4.412
-277.17%
1 janv. 1988
1.009
-1.811
-64.23%
1 janv. 1989
-4.689
-5.698
-564.76%
1 janv. 1990
6.263
+10.952
-233.58%
1 janv. 1991
-4.253
-10.516
-167.91%
1 janv. 1992
-12.264
-8.011
188.34%
1 janv. 1993
-18.484
-6.22
50.72%
1 janv. 1994
72.01
+90.495
-489.57%
1 janv. 1995
14.699
-57.311
-79.59%
1 janv. 1996
-3.84
-18.539
-126.12%
1 janv. 1997
5.908
+9.748
-253.86%
1 janv. 1998
0.38
-5.529
-93.58%
1 janv. 1999
10.128
+9.748
2.57 milles%
1 janv. 2000
13.411
+3.284
32.42%
1 janv. 2001
-23.144
-36.555
-272.57%
1 janv. 2002
20.594
+43.738
-188.98%
1 janv. 2003
6.323
-14.271
-69.3%
1 janv. 2004
-9.547
-15.87
-250.99%
1 janv. 2005
-2.608
+6.939
-72.69%
1 janv. 2006
-5.954
-3.346
128.32%
1 janv. 2007
-5.112
+0.841
-14.13%
1 janv. 2008
-3.571
+1.541
-30.14%
1 janv. 2009
-1.335
+2.236
-62.61%
1 janv. 2010
26.694
+28.029
-2.1 milles%
1 janv. 2011
4.18
-22.514
-84.34%
1 janv. 2012
13.294
+9.114
218.02%
1 janv. 2013
3.815
-9.479
-71.3%
1 janv. 2014
-13.075
-16.89
-442.7%
1 janv. 2015
5.664
+18.739
-143.32%
1 janv. 2016
10.59
+4.926
86.97%
Classement des pays selon les statistiques actuelles par années


Commentaires: