29
/fr/
fr
AIzaSyAYiBZKx7MnpbEhh9jyipgxe19OcubqV5w
April 1, 2024
252276
St. Vincent and the Grenadines
VCT
true
2
1
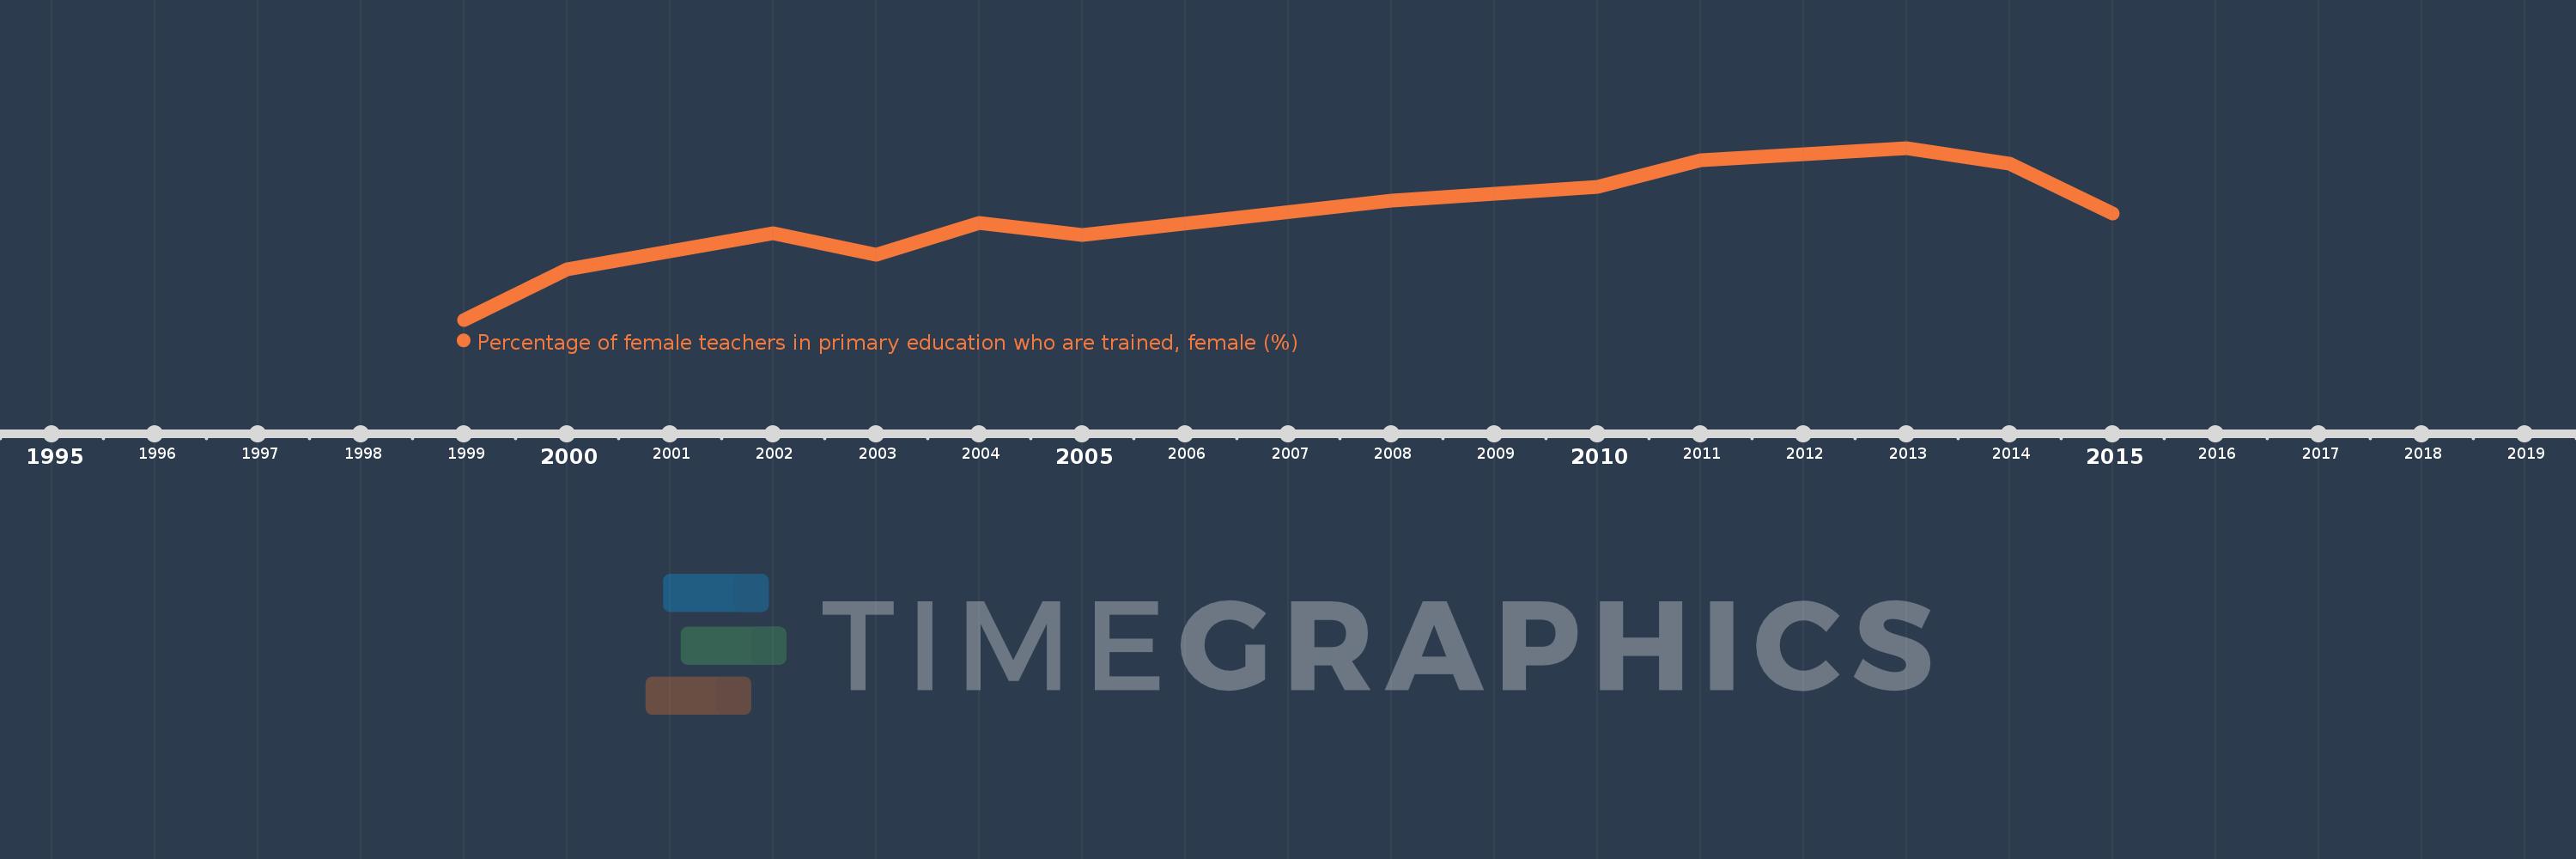
Percentage of female teachers in primary education who are trained, female (%)
2015,2014,2013,2011,2010,2008,2005,2004,2003,2002,2000,1999
Cette statistique dans les autres pays:
La ligne de temps
Cette échelle de temps montre un graphique de 1999 année à 2015 année St. Vincent and the Grenadines. Les données jusqu'à 1998 année ne sont pas présentés. Quantité d'observations actuelles selon dates: 12.
Source (désignation):
Les indicateurs du développement mondiale
Source (organisation):
United Nations Educational, Scientific, and Cultural Organization (UNESCO) Institute for Statistics.
Catégories:
Education, Gender
Dernière mise à jour
23 avr. 2017
Les indicateurs de changement de valeurs selon les années
Maximum:
88.478
1 janv. 2013
Pour la date d''observation
Valeur
Changement absolu
Le changement par rapport à la valeur précédente
1 janv. 1999
61.0
+61.0
0.0%
1 janv. 2000
69.132
+8.132
13.33%
1 janv. 2002
74.793
+5.661
8.19%
1 janv. 2003
71.371
-3.422
-4.58%
1 janv. 2004
76.418
+5.047
7.07%
1 janv. 2005
74.627
-1.791
-2.34%
1 janv. 2008
80.111
+5.484
7.35%
1 janv. 2010
82.242
+2.13
2.66%
1 janv. 2011
86.541
+4.3
5.23%
1 janv. 2013
88.478
+1.937
2.24%
1 janv. 2014
85.955
-2.523
-2.85%
1 janv. 2015
78.02
-7.935
-9.23%
Classement des pays selon les statistiques actuelles par années


Commentaires: