29
/fr/
fr
AIzaSyAYiBZKx7MnpbEhh9jyipgxe19OcubqV5w
April 1, 2024
231502
Rwanda
RWA
true
2
1
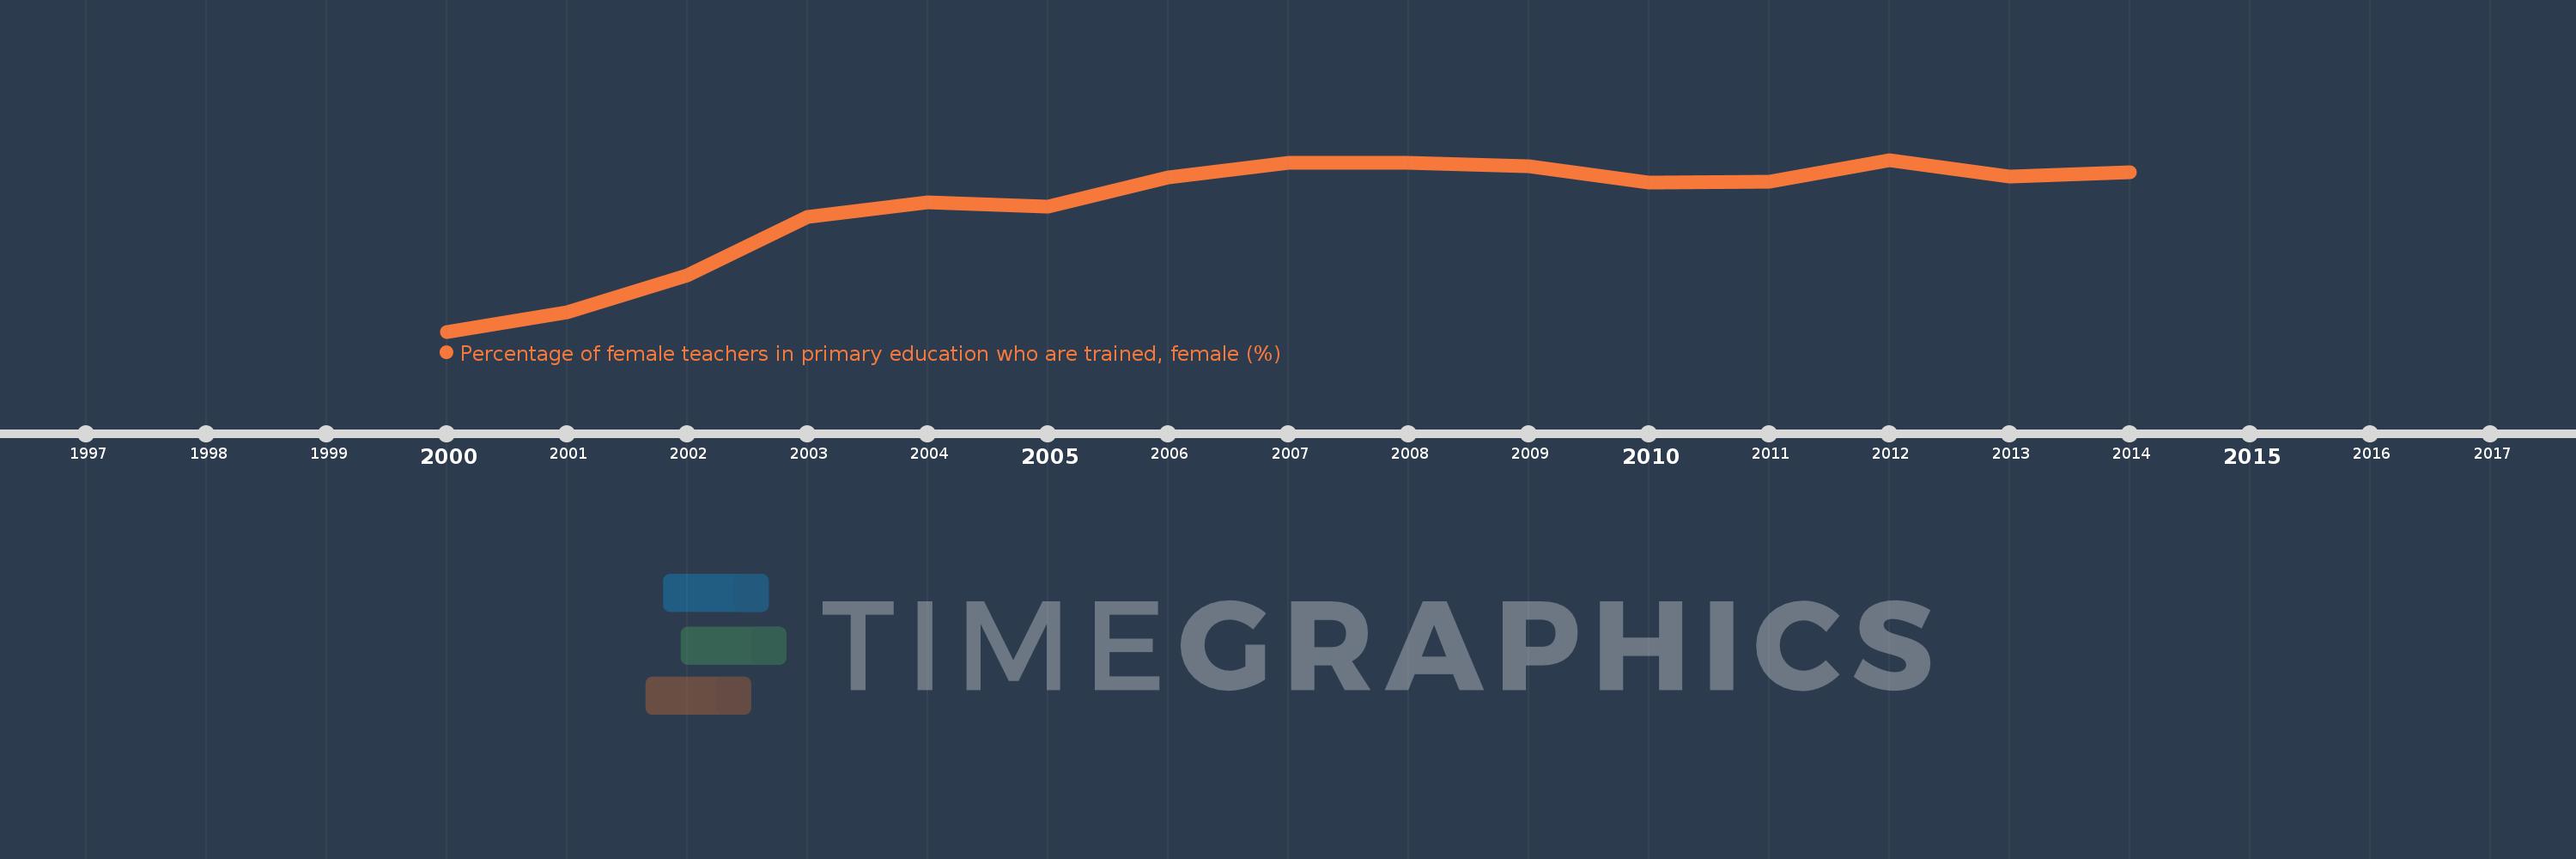
Percentage of female teachers in primary education who are trained, female (%)
2014,2013,2012,2011,2010,2009,2008,2007,2006,2005,2004,2003,2002,2001,2000
Cette statistique dans les autres pays:
La ligne de temps
Cette échelle de temps montre un graphique de 2000 année à 2014 année Rwanda. Les données jusqu'à 1999 année ne sont pas présentés. Quantité d'observations actuelles selon dates: 15.
Source (désignation):
Les indicateurs du développement mondiale
Source (organisation):
United Nations Educational, Scientific, and Cultural Organization (UNESCO) Institute for Statistics.
Catégories:
Education, Gender
Dernière mise à jour
23 avr. 2017
Les indicateurs de changement de valeurs selon les années
Minimum:
45.873
1 janv. 2000
Maximum:
99.259
1 janv. 2012
Pour la date d''observation
Valeur
Changement absolu
Le changement par rapport à la valeur précédente
1 janv. 2000
45.873
+45.873
0.0%
1 janv. 2001
51.873
+6.0
13.08%
1 janv. 2002
63.305
+11.432
22.04%
1 janv. 2003
81.554
+18.249
28.83%
1 janv. 2004
85.974
+4.42
5.42%
1 janv. 2005
84.583
-1.39
-1.62%
1 janv. 2006
93.889
+9.306
11.0%
1 janv. 2007
98.3
+4.411
4.7%
1 janv. 2008
98.421
+0.121
0.12%
1 janv. 2009
97.278
-1.143
-1.16%
1 janv. 2010
92.309
-4.969
-5.11%
1 janv. 2011
92.441
+0.132
0.14%
1 janv. 2012
99.259
+6.818
7.38%
1 janv. 2013
94.135
-5.124
-5.16%
1 janv. 2014
95.372
+1.237
1.31%
Classement des pays selon les statistiques actuelles par années


Commentaires: