29
/fr/
fr
AIzaSyAYiBZKx7MnpbEhh9jyipgxe19OcubqV5w
April 1, 2024
169840
Korea, Rep.
KOR
true
2
1
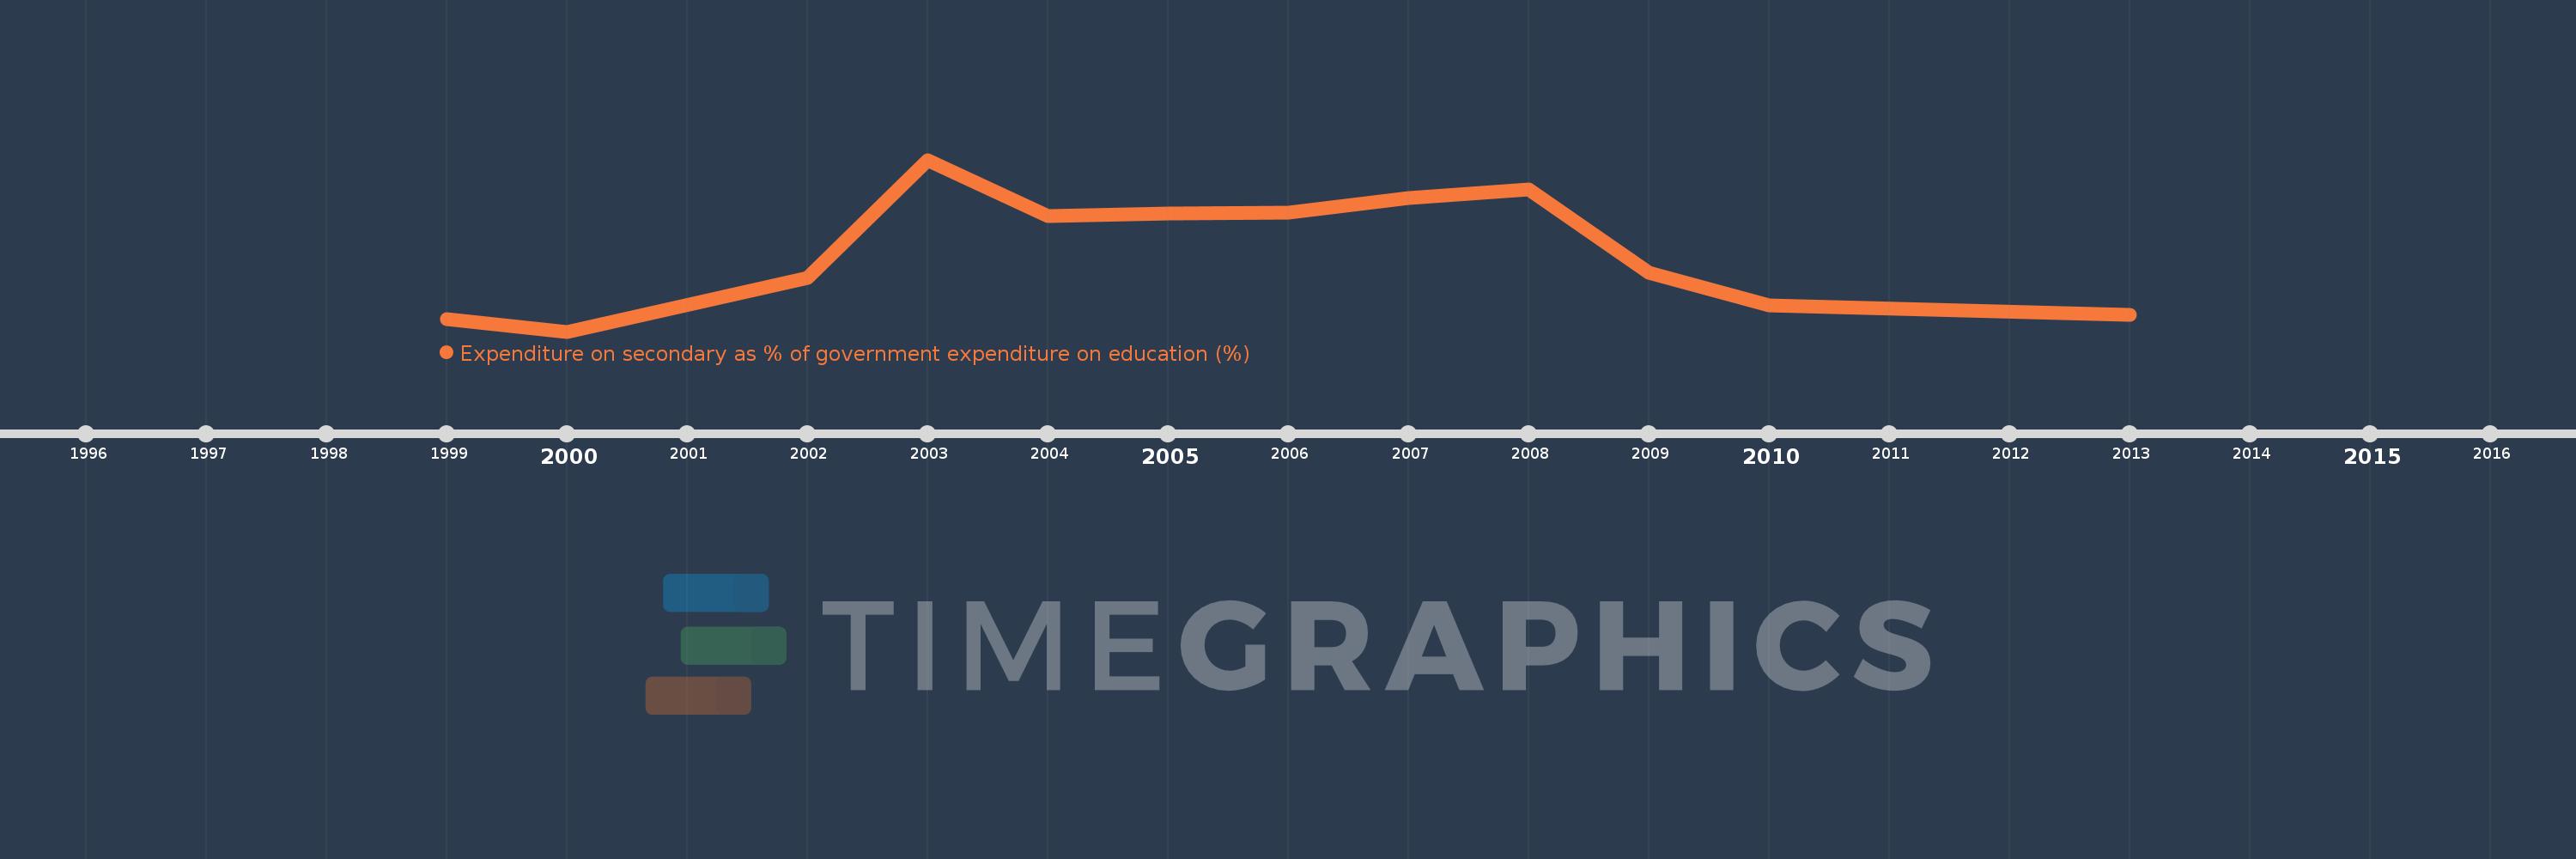
Expenditure on secondary as % of government expenditure on education (%)
2013,2010,2009,2008,2007,2006,2005,2004,2003,2002,2000,1999
Cette statistique dans les autres pays:
La ligne de temps
Cette échelle de temps montre un graphique de 1999 année à 2013 année Korea, Rep.. Les données jusqu'à 1998 année ne sont pas présentés. Quantité d'observations actuelles selon dates: 12.
Source (désignation):
Les indicateurs du développement mondiale
Source (organisation):
UNESCO Institute for Statistics
Catégories:
Education
Dernière mise à jour
23 avr. 2017
Les indicateurs de changement de valeurs selon les années
Minimum:
37.279
1 janv. 2000
Maximum:
43.405
1 janv. 2003
Pour la date d''observation
Valeur
Changement absolu
Le changement par rapport à la valeur précédente
1 janv. 1999
37.736
+37.736
0.0%
1 janv. 2000
37.279
-0.457
-1.21%
1 janv. 2002
39.182
+1.903
5.1%
1 janv. 2003
43.405
+4.223
10.78%
1 janv. 2004
41.412
-1.993
-4.59%
1 janv. 2005
41.486
+0.073
0.18%
1 janv. 2006
41.509
+0.024
0.06%
1 janv. 2007
42.039
+0.53
1.28%
1 janv. 2008
42.359
+0.319
0.76%
1 janv. 2009
39.369
-2.989
-7.06%
1 janv. 2010
38.22
-1.149
-2.92%
1 janv. 2013
37.877
-0.343
-0.9%
Classement des pays selon les statistiques actuelles par années


Commentaires: