29
/it/
it
AIzaSyAYiBZKx7MnpbEhh9jyipgxe19OcubqV5w
April 1, 2024
169840
Korea, Rep.
KOR
true
2
1
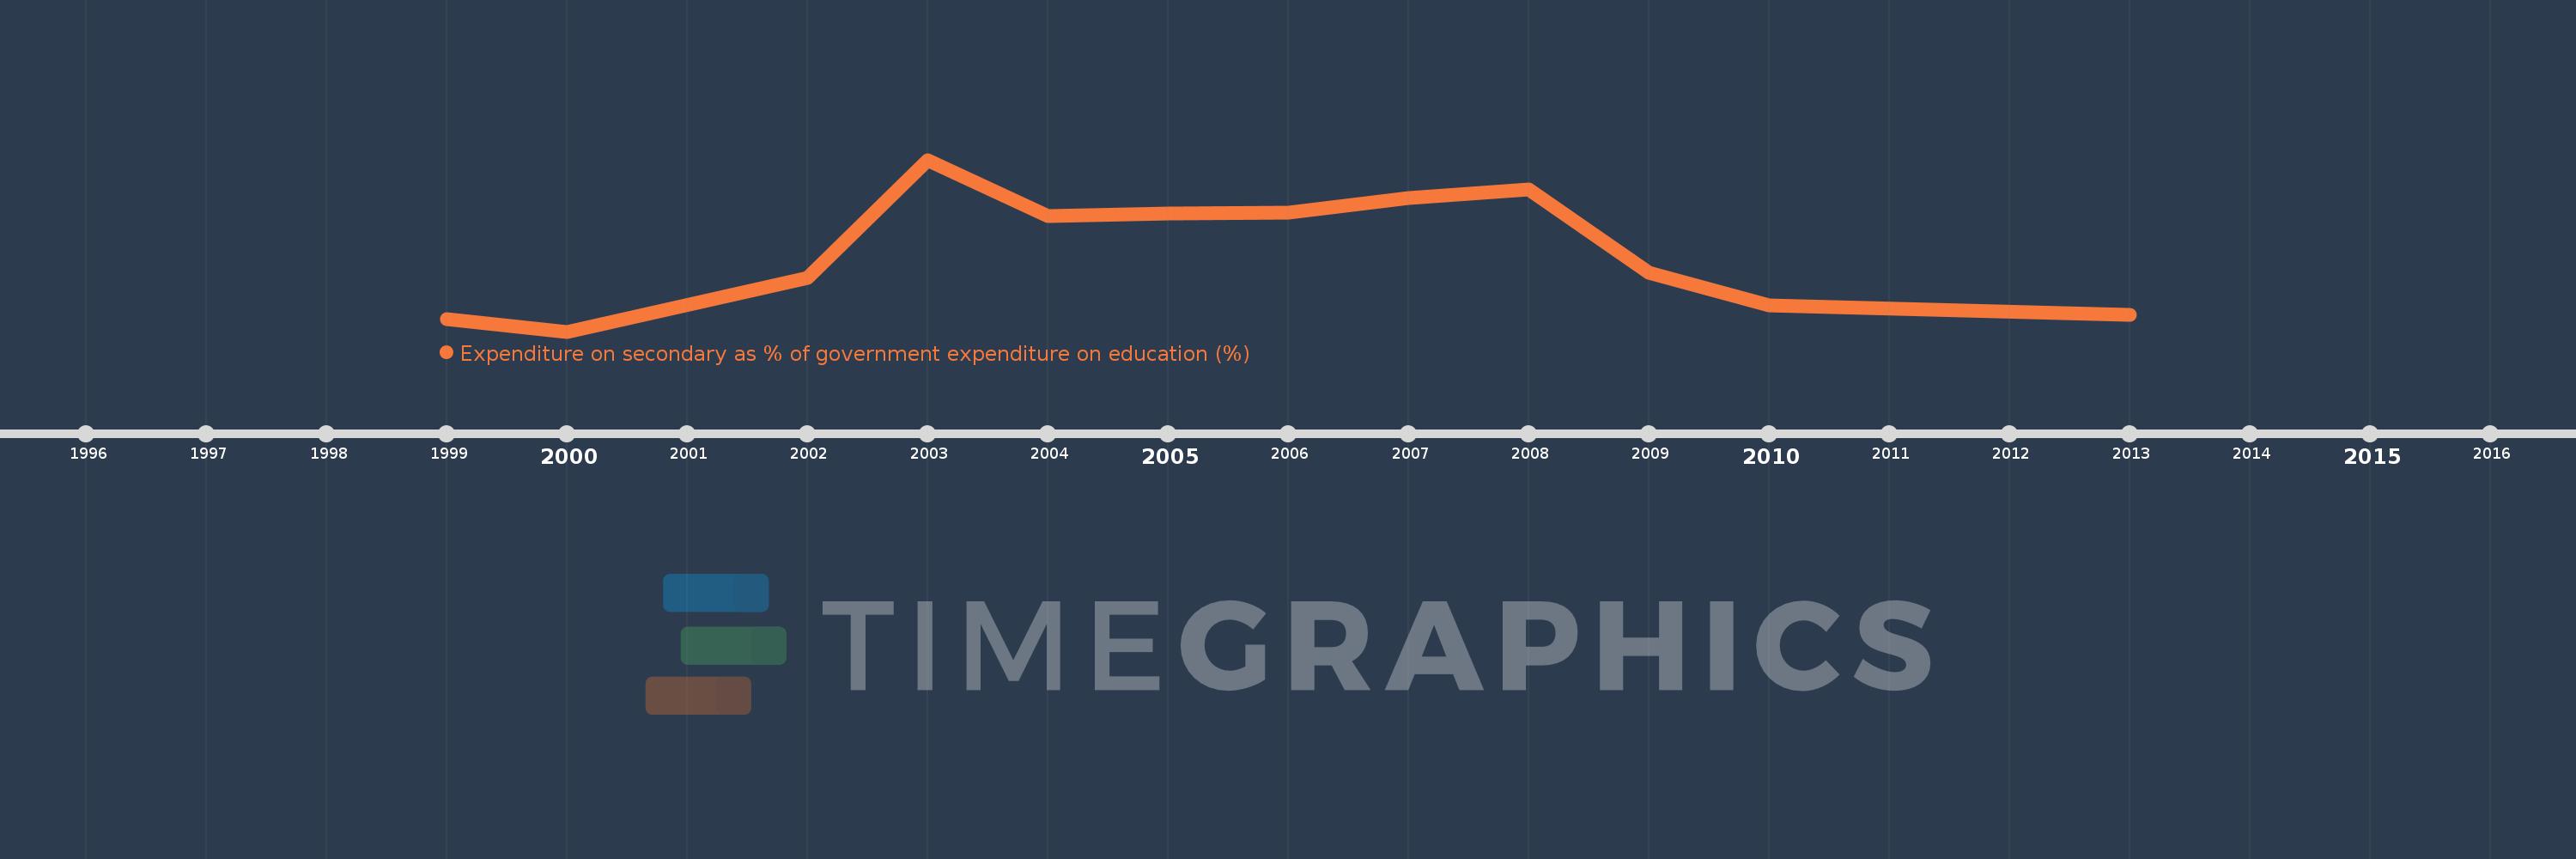
Expenditure on secondary as % of government expenditure on education (%)
2013,2010,2009,2008,2007,2006,2005,2004,2003,2002,2000,1999
Queste statistiche in altri paesi:
Linea del tempo:
Questa scala temporale mostra un grafico dal 1999 anno al 2013 anno. Korea, Rep.. I dati fino ad 1998 anno non disponibili. Il numero di osservazioni attuali secondo i date: 12.
La fonte (nome):
Indicatori dello sviluppo mondiale
La fonte (organizzazione):
UNESCO Institute for Statistics
Categorie:
Education
sono stati aggiornati
23 apr 2017 anni
Indicatori delle variazioni dei valori per anni
Minima:
37.279
1 gen 2000 anni
Massimo:
43.405
1 gen 2003 anni
Alla data di osservazione
Valore
Variazione assoluta
La variazione rispetto al valore precedente
1 gen 1999 anni
37.736
+37.736
0.0%
1 gen 2000 anni
37.279
-0.457
-1.21%
1 gen 2002 anni
39.182
+1.903
5.1%
1 gen 2003 anni
43.405
+4.223
10.78%
1 gen 2004 anni
41.412
-1.993
-4.59%
1 gen 2005 anni
41.486
+0.073
0.18%
1 gen 2006 anni
41.509
+0.024
0.06%
1 gen 2007 anni
42.039
+0.53
1.28%
1 gen 2008 anni
42.359
+0.319
0.76%
1 gen 2009 anni
39.369
-2.989
-7.06%
1 gen 2010 anni
38.22
-1.149
-2.92%
1 gen 2013 anni
37.877
-0.343
-0.9%
Classificazione dei paesi secondo i statistiche attuali per anni


Commenti: