29
/fr/
fr
AIzaSyAYiBZKx7MnpbEhh9jyipgxe19OcubqV5w
April 1, 2024
126096
El Salvador
SLV
true
2
1
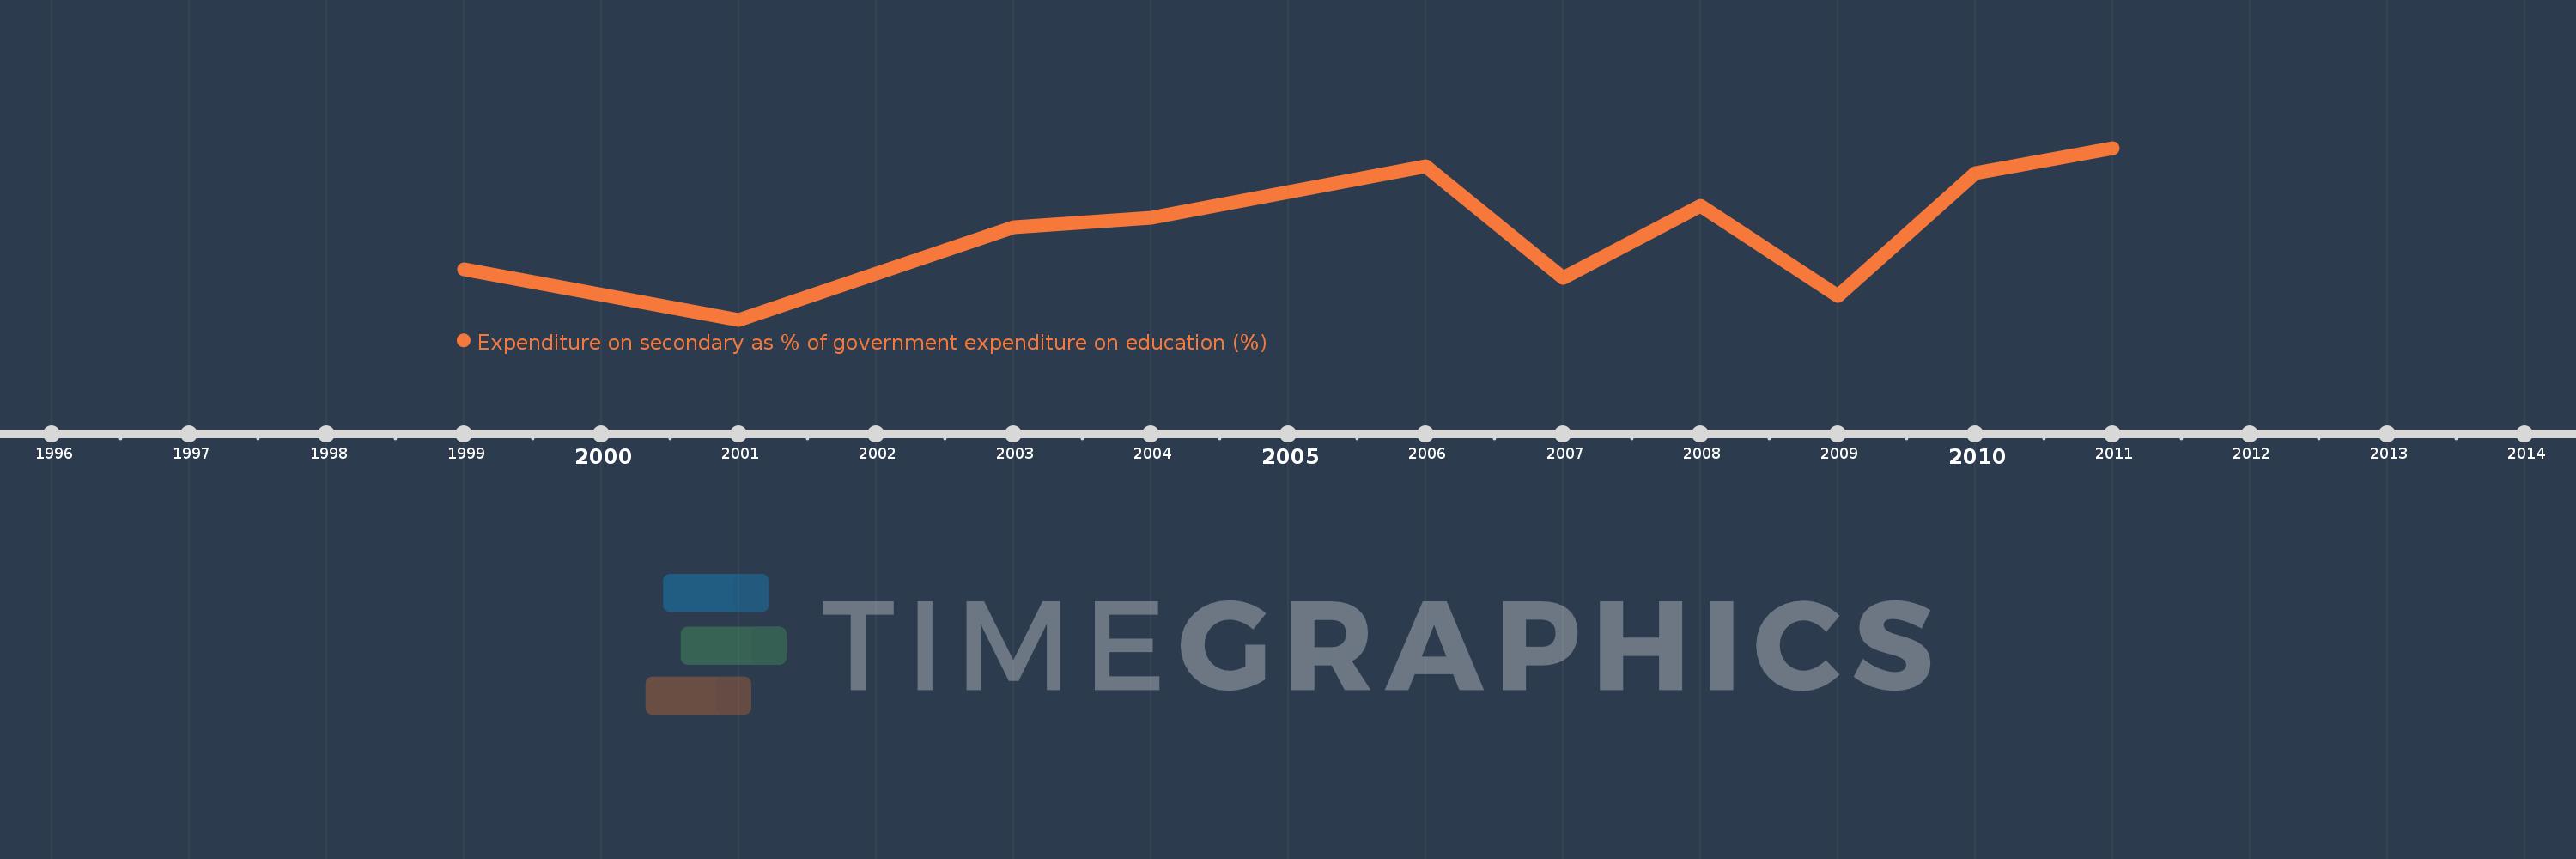
Expenditure on secondary as % of government expenditure on education (%)
2011,2010,2009,2008,2007,2006,2004,2003,2001,1999
Cette statistique dans les autres pays:
La ligne de temps
Cette échelle de temps montre un graphique de 1999 année à 2011 année El Salvador. Les données jusqu'à 1998 année ne sont pas présentés. Quantité d'observations actuelles selon dates: 10.
Source (désignation):
Les indicateurs du développement mondiale
Source (organisation):
UNESCO Institute for Statistics
Catégories:
Education
Dernière mise à jour
23 avr. 2017
Les indicateurs de changement de valeurs selon les années
Minimum:
20.764
1 janv. 2001
Maximum:
30.095
1 janv. 2011
Pour la date d''observation
Valeur
Changement absolu
Le changement par rapport à la valeur précédente
1 janv. 1999
23.493
+23.493
0.0%
1 janv. 2001
20.764
-2.729
-11.62%
1 janv. 2003
25.794
+5.03
24.23%
1 janv. 2004
26.279
+0.484
1.88%
1 janv. 2006
29.088
+2.809
10.69%
1 janv. 2007
23.03
-6.058
-20.83%
1 janv. 2008
26.969
+3.939
17.1%
1 janv. 2009
22.046
-4.923
-18.25%
1 janv. 2010
28.747
+6.701
30.4%
1 janv. 2011
30.095
+1.347
4.69%
Classement des pays selon les statistiques actuelles par années


Commentaires: